

Relevant
How important is Walmex to Walmart Inc.?

Walmart Inc. closed the end of January with more than 92 million square meters in total floor space, 27% of which would be operating outside of the United States.
To give a sense of just how massive this figure is, the city of Paris would barely be able to fit the 10 thousand Walmart stores operating across the world within its territory.
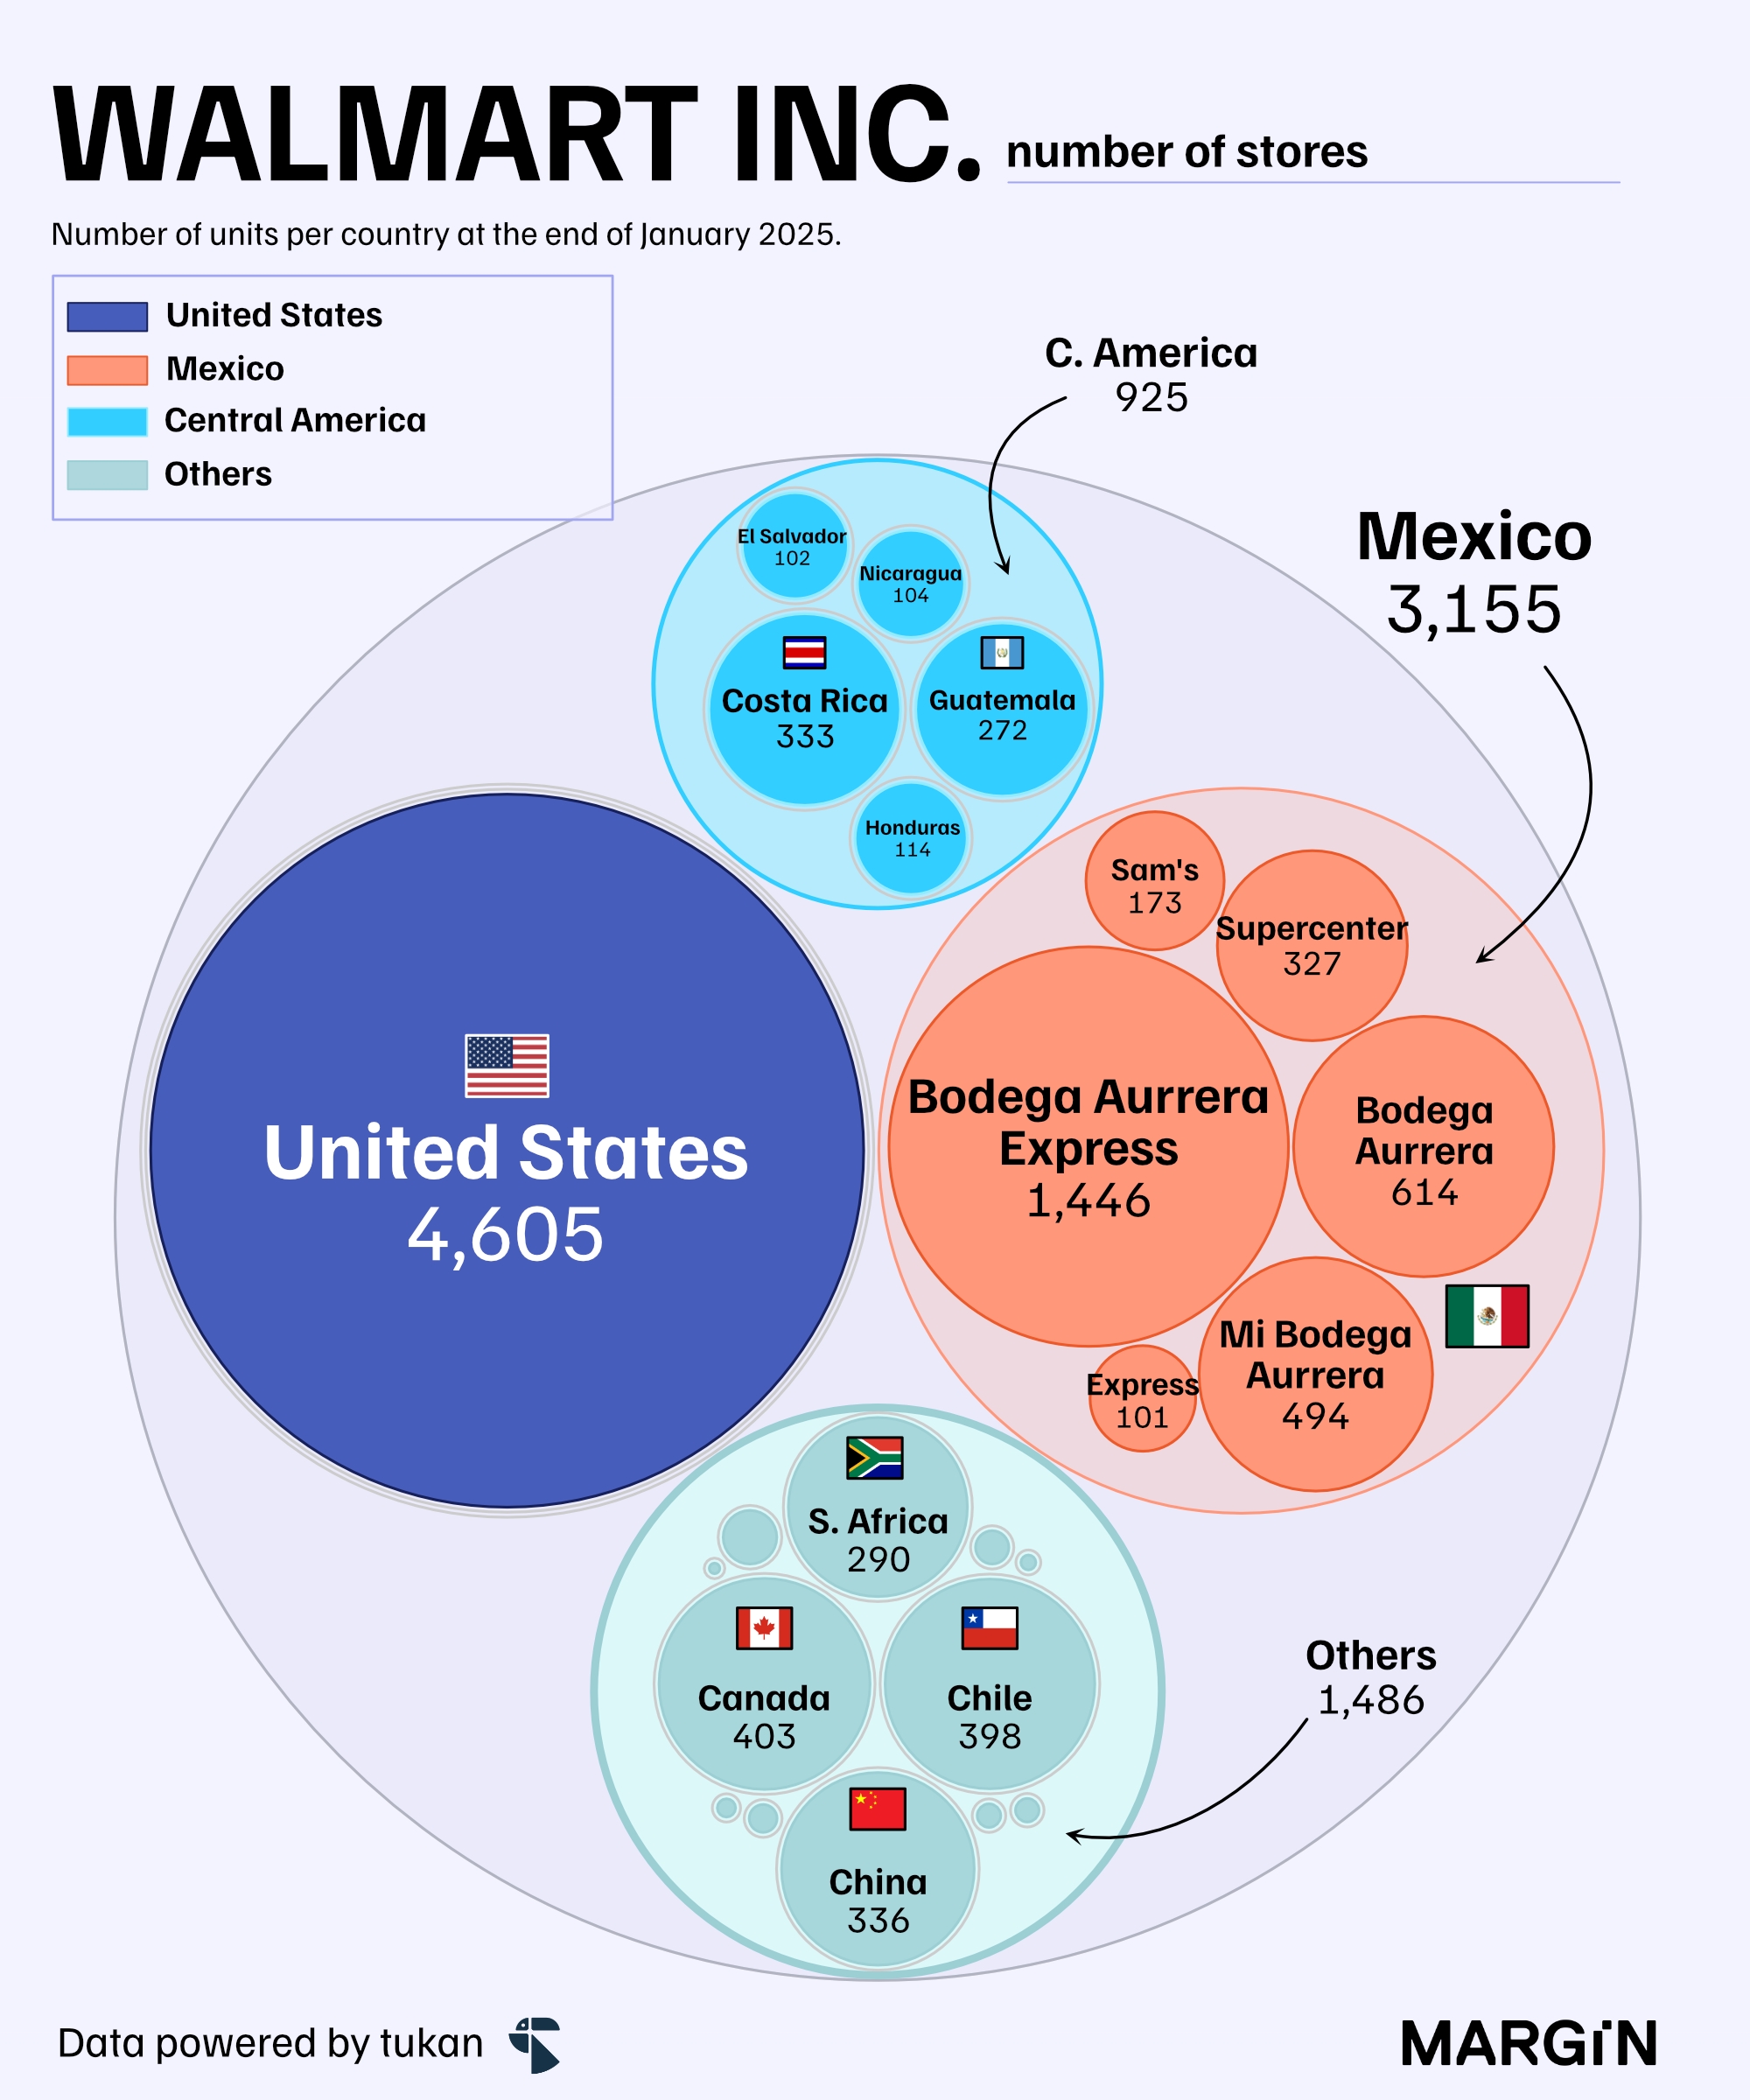
Despite accounting for more than 30% of total stores, Walmart Mexico represented only just 7% of total floor space at the end of 2024 — as average store sizes in the Latin American country were considerably smaller to those in the United States and other markets.
For example, an average Supercenter in the United States would have an area of 16.5 thousand square meters, a figure 125% higher than a Supercenter in Mexico.
Interestingly, total floorspace in Mexico has grown by more than 10% during the last 5 years. Contrasting heavily with the contractions seen in the U.S. (-0.7%) and the rest of the company’s international footprint (-28%) during the same period.
It’s important to note that the international contraction was also largely affected by the divestment of the company’s operations in the United Kingdom and Japan in 2021.
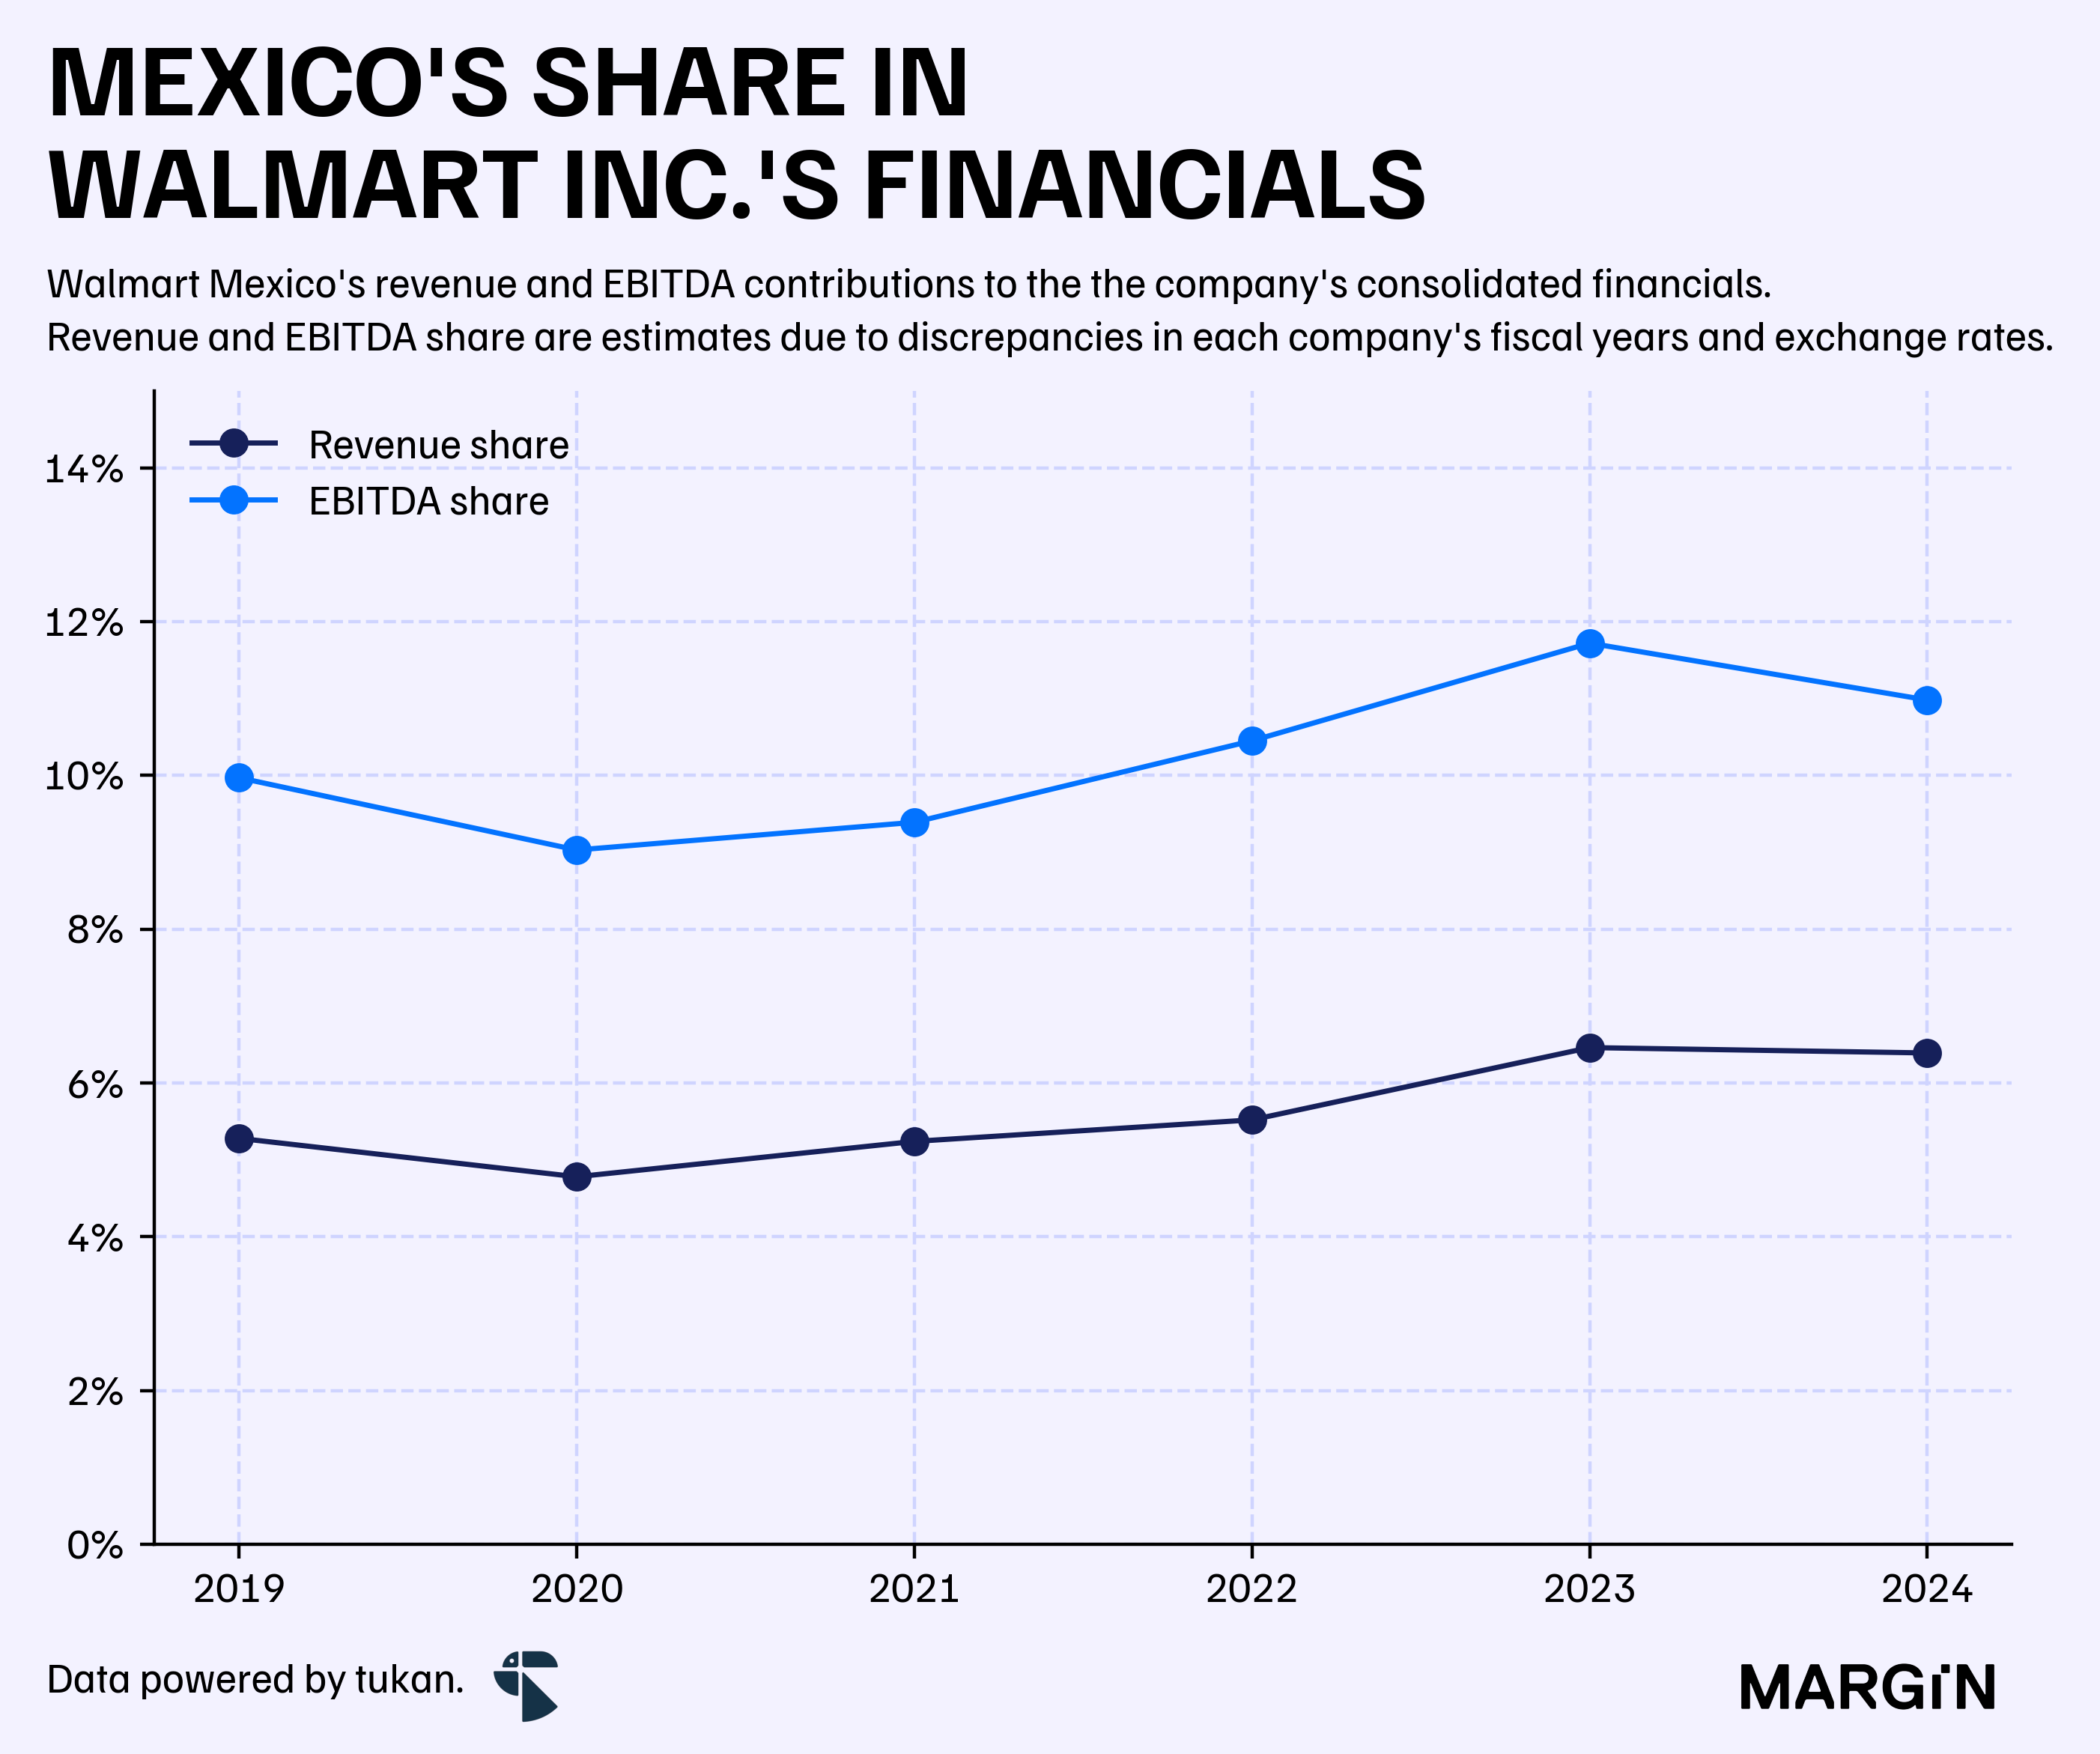
Based on our estimates from company filings, Walmart Mexico accounts for a relatively small share of the holding’s total revenues — 6.4%, as of the latest fiscal year.
Whenever we refer to Walmart Mexico, we are excluding Central American operations — unless explicitly stated otherwise.
However, Mexico’s share across Walmart Inc’s. EBITDA came in considerably higher, at 11% — and has been consistently gaining further relevance in recent years, in part, benefitted by the Mexican peso’s appreciation against the U.S. dollar.
According to the company’s latest 10-K, the U.S. retail operation had an EBITDA margin of 6.8% — a ratio 393 basis points lower than it’s Mexican subsidiary (10.7%).
For an industry that operates under such tight margins, that’s a massive difference in efficiency and profitability.
These benefits to the company’s bottom-line have led the holding to make some heavy investments south of the border. For example, in the past 2 years CAPEX in retail operations as a percentage of total sales has been close to 2.89% for the Mexican & Central American subsidiary — whereas other international operations have received investments equivalent to 2.32% of those region’s total revenues; with U.S. retail operations receiving 2.62% of total revenues.
With the risk of oversimplifying, this would imply that for every dollar sold, the Mexican & Central American operation would be sending 10% more of those revenues into CAPEX than the U.S. retail business; and 25% more than other international operations.
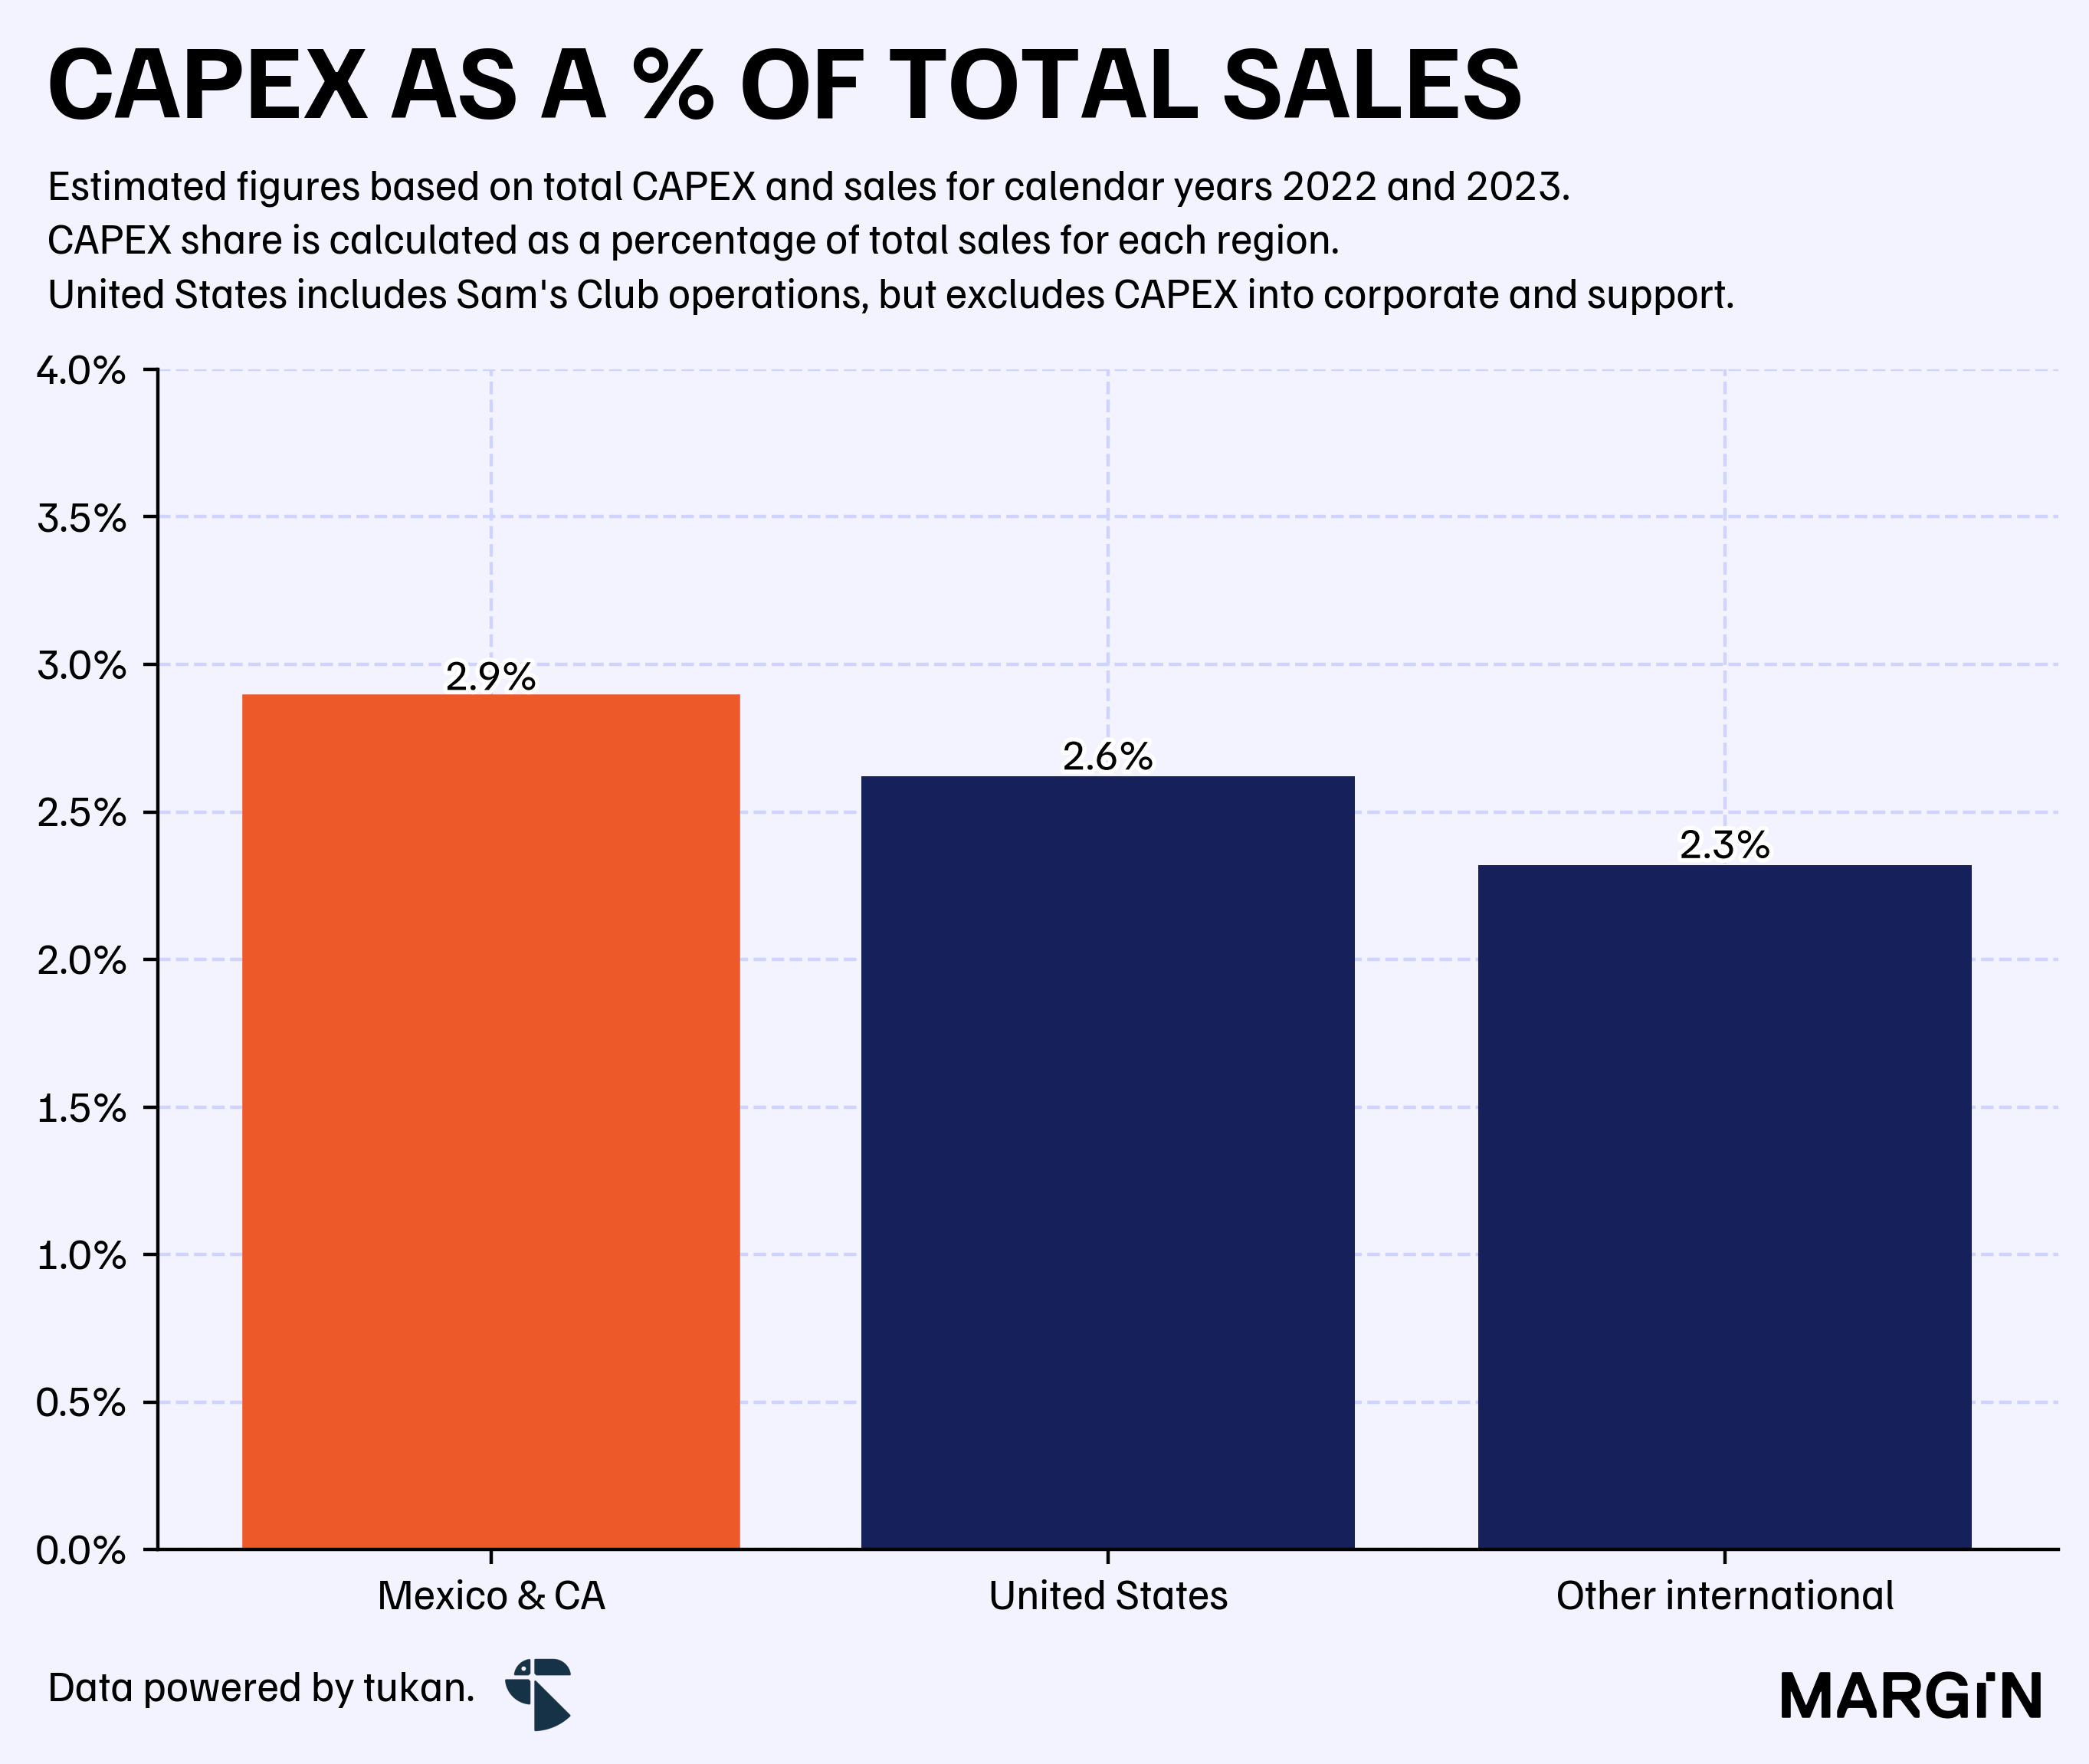
Walmart Inc. as a whole usually has a CAPEX to sales ratio of 3.5%, however over 10% of those expenditures are directed to the “corporate and support” segment.
So, what makes the Mexican operation so attractive?
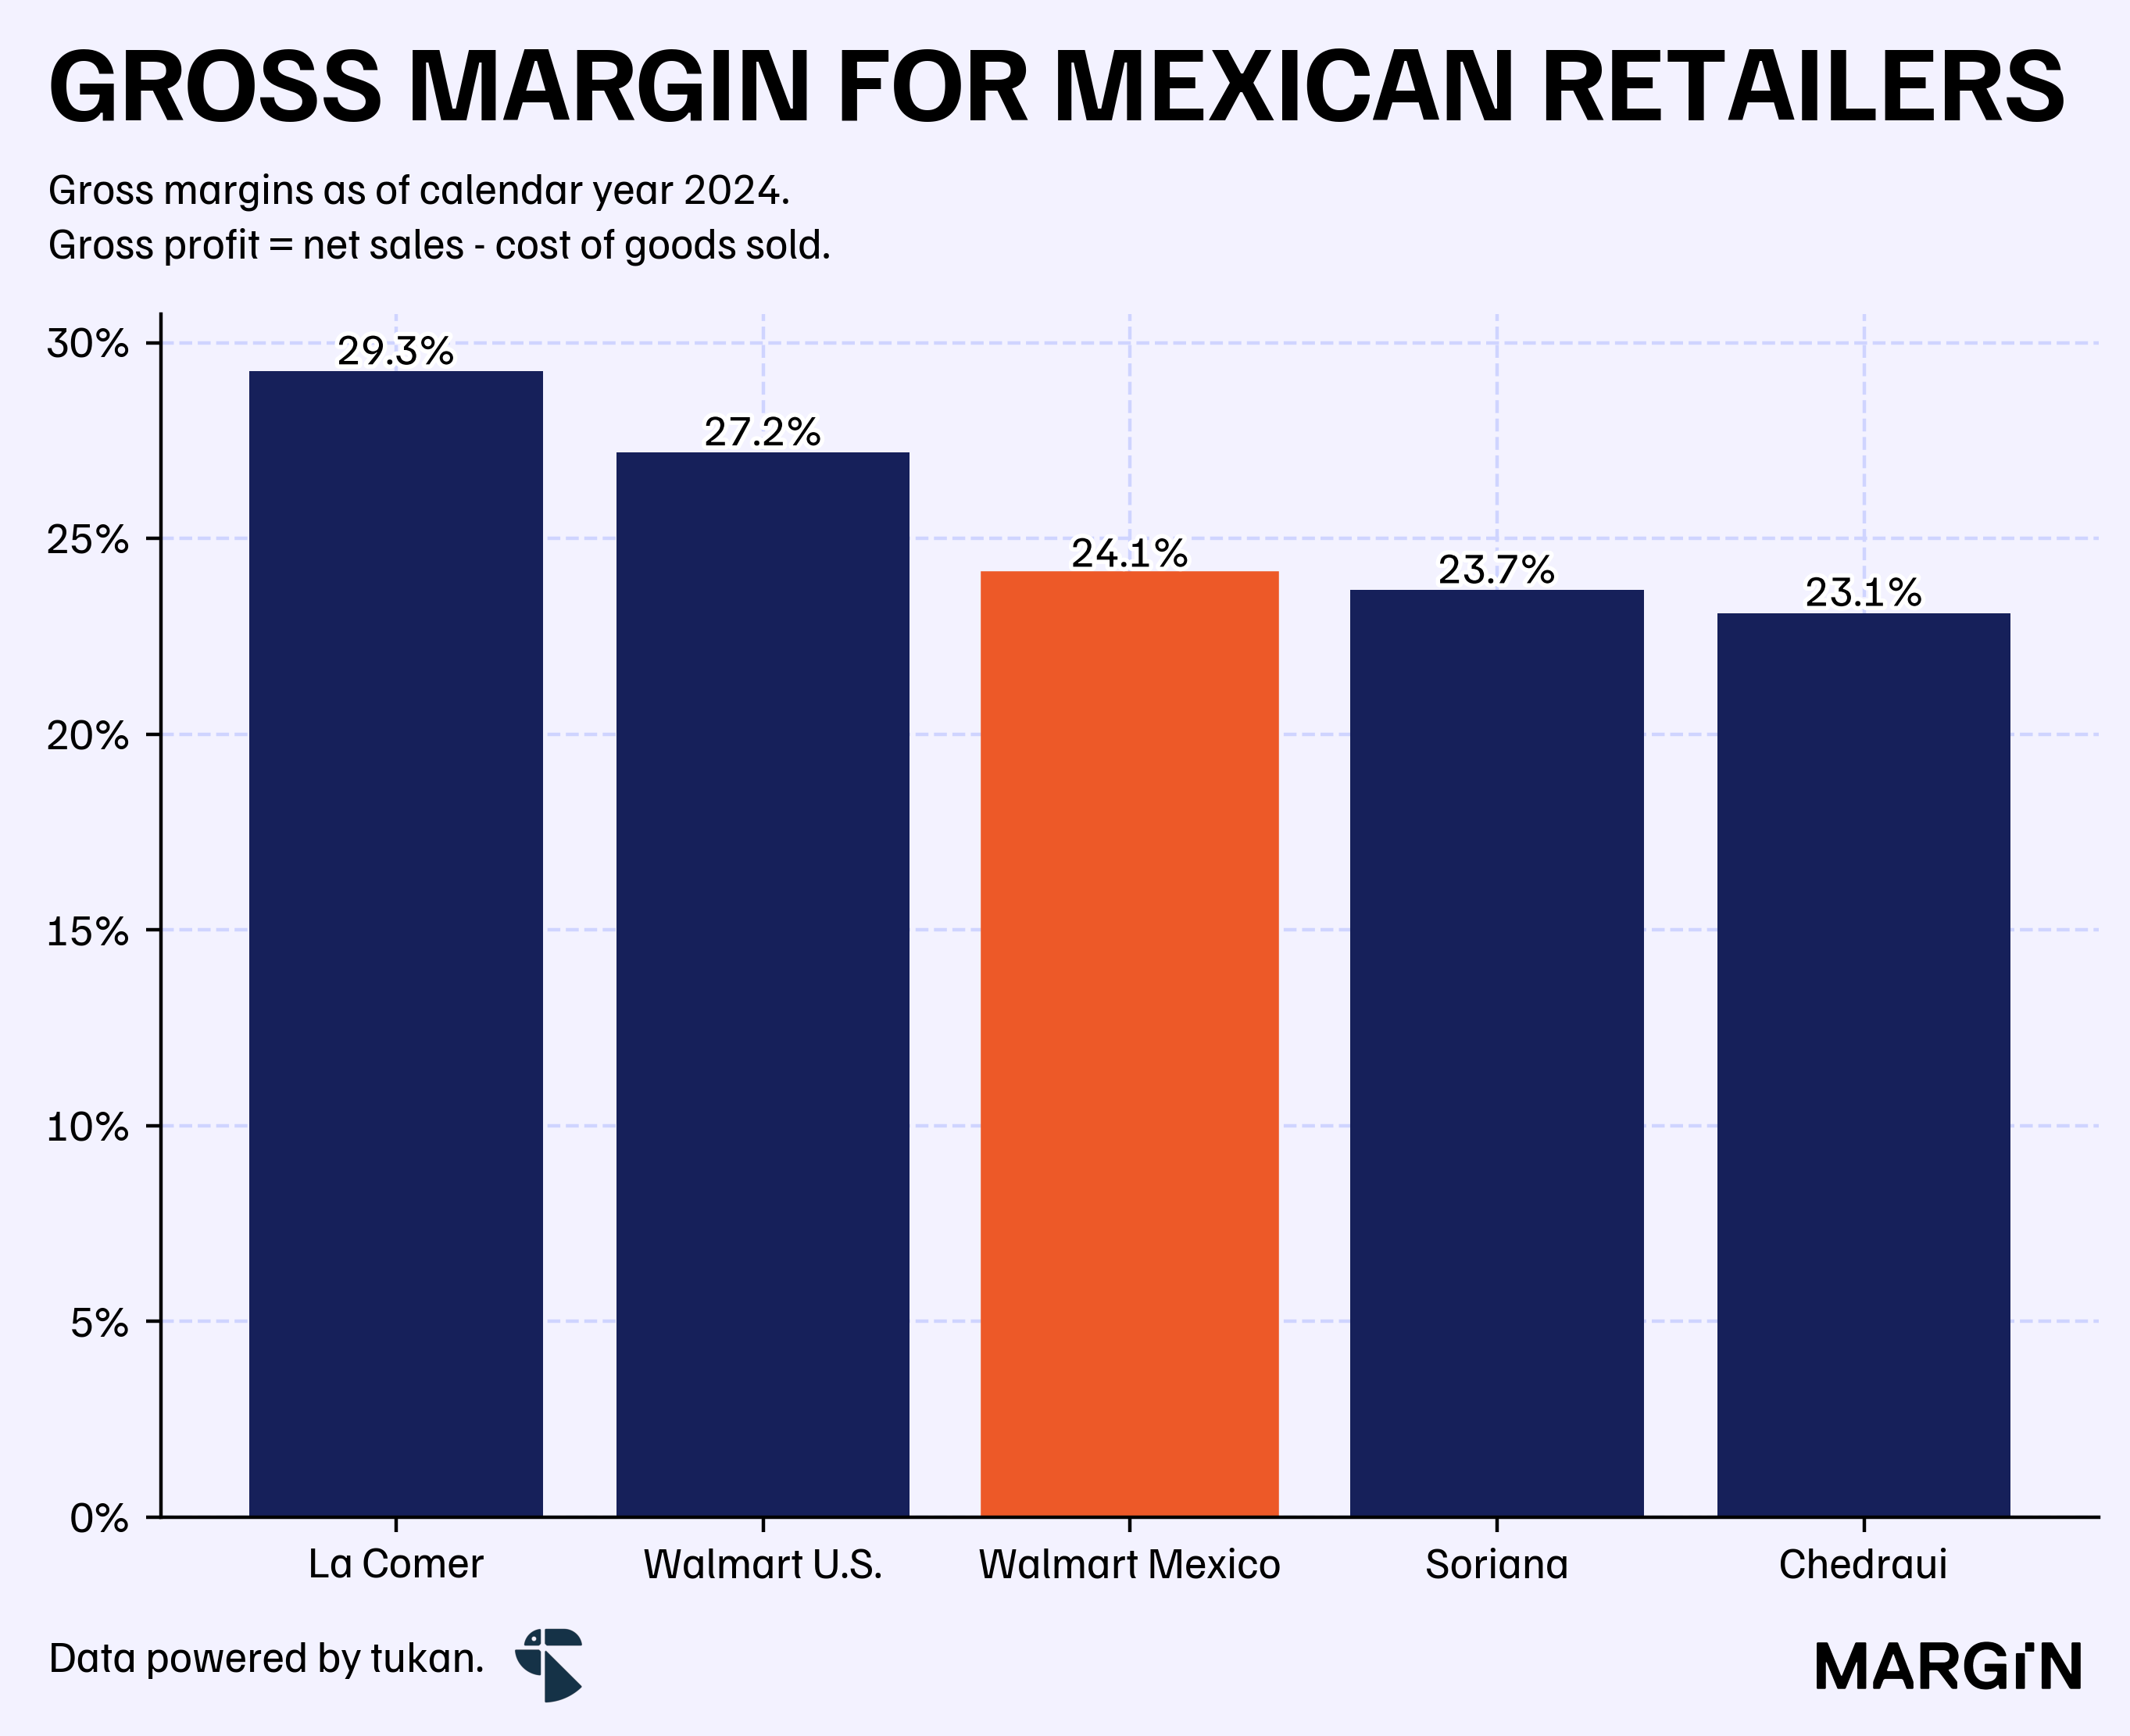
For starters, it’s important to note that gross margins are considerably higher in the United States, largely driven by the country’s reduced exposure to general groceries revenues relative to other markets.
Furthermore, Mexican operations have a strong dependance on discount stores, which as of 2023 accounted for more than 40% of the company’s total revenues.
As expected, the “premium” in margins from Mexican operations comes from considerably lower labor costs and general operating expenses.
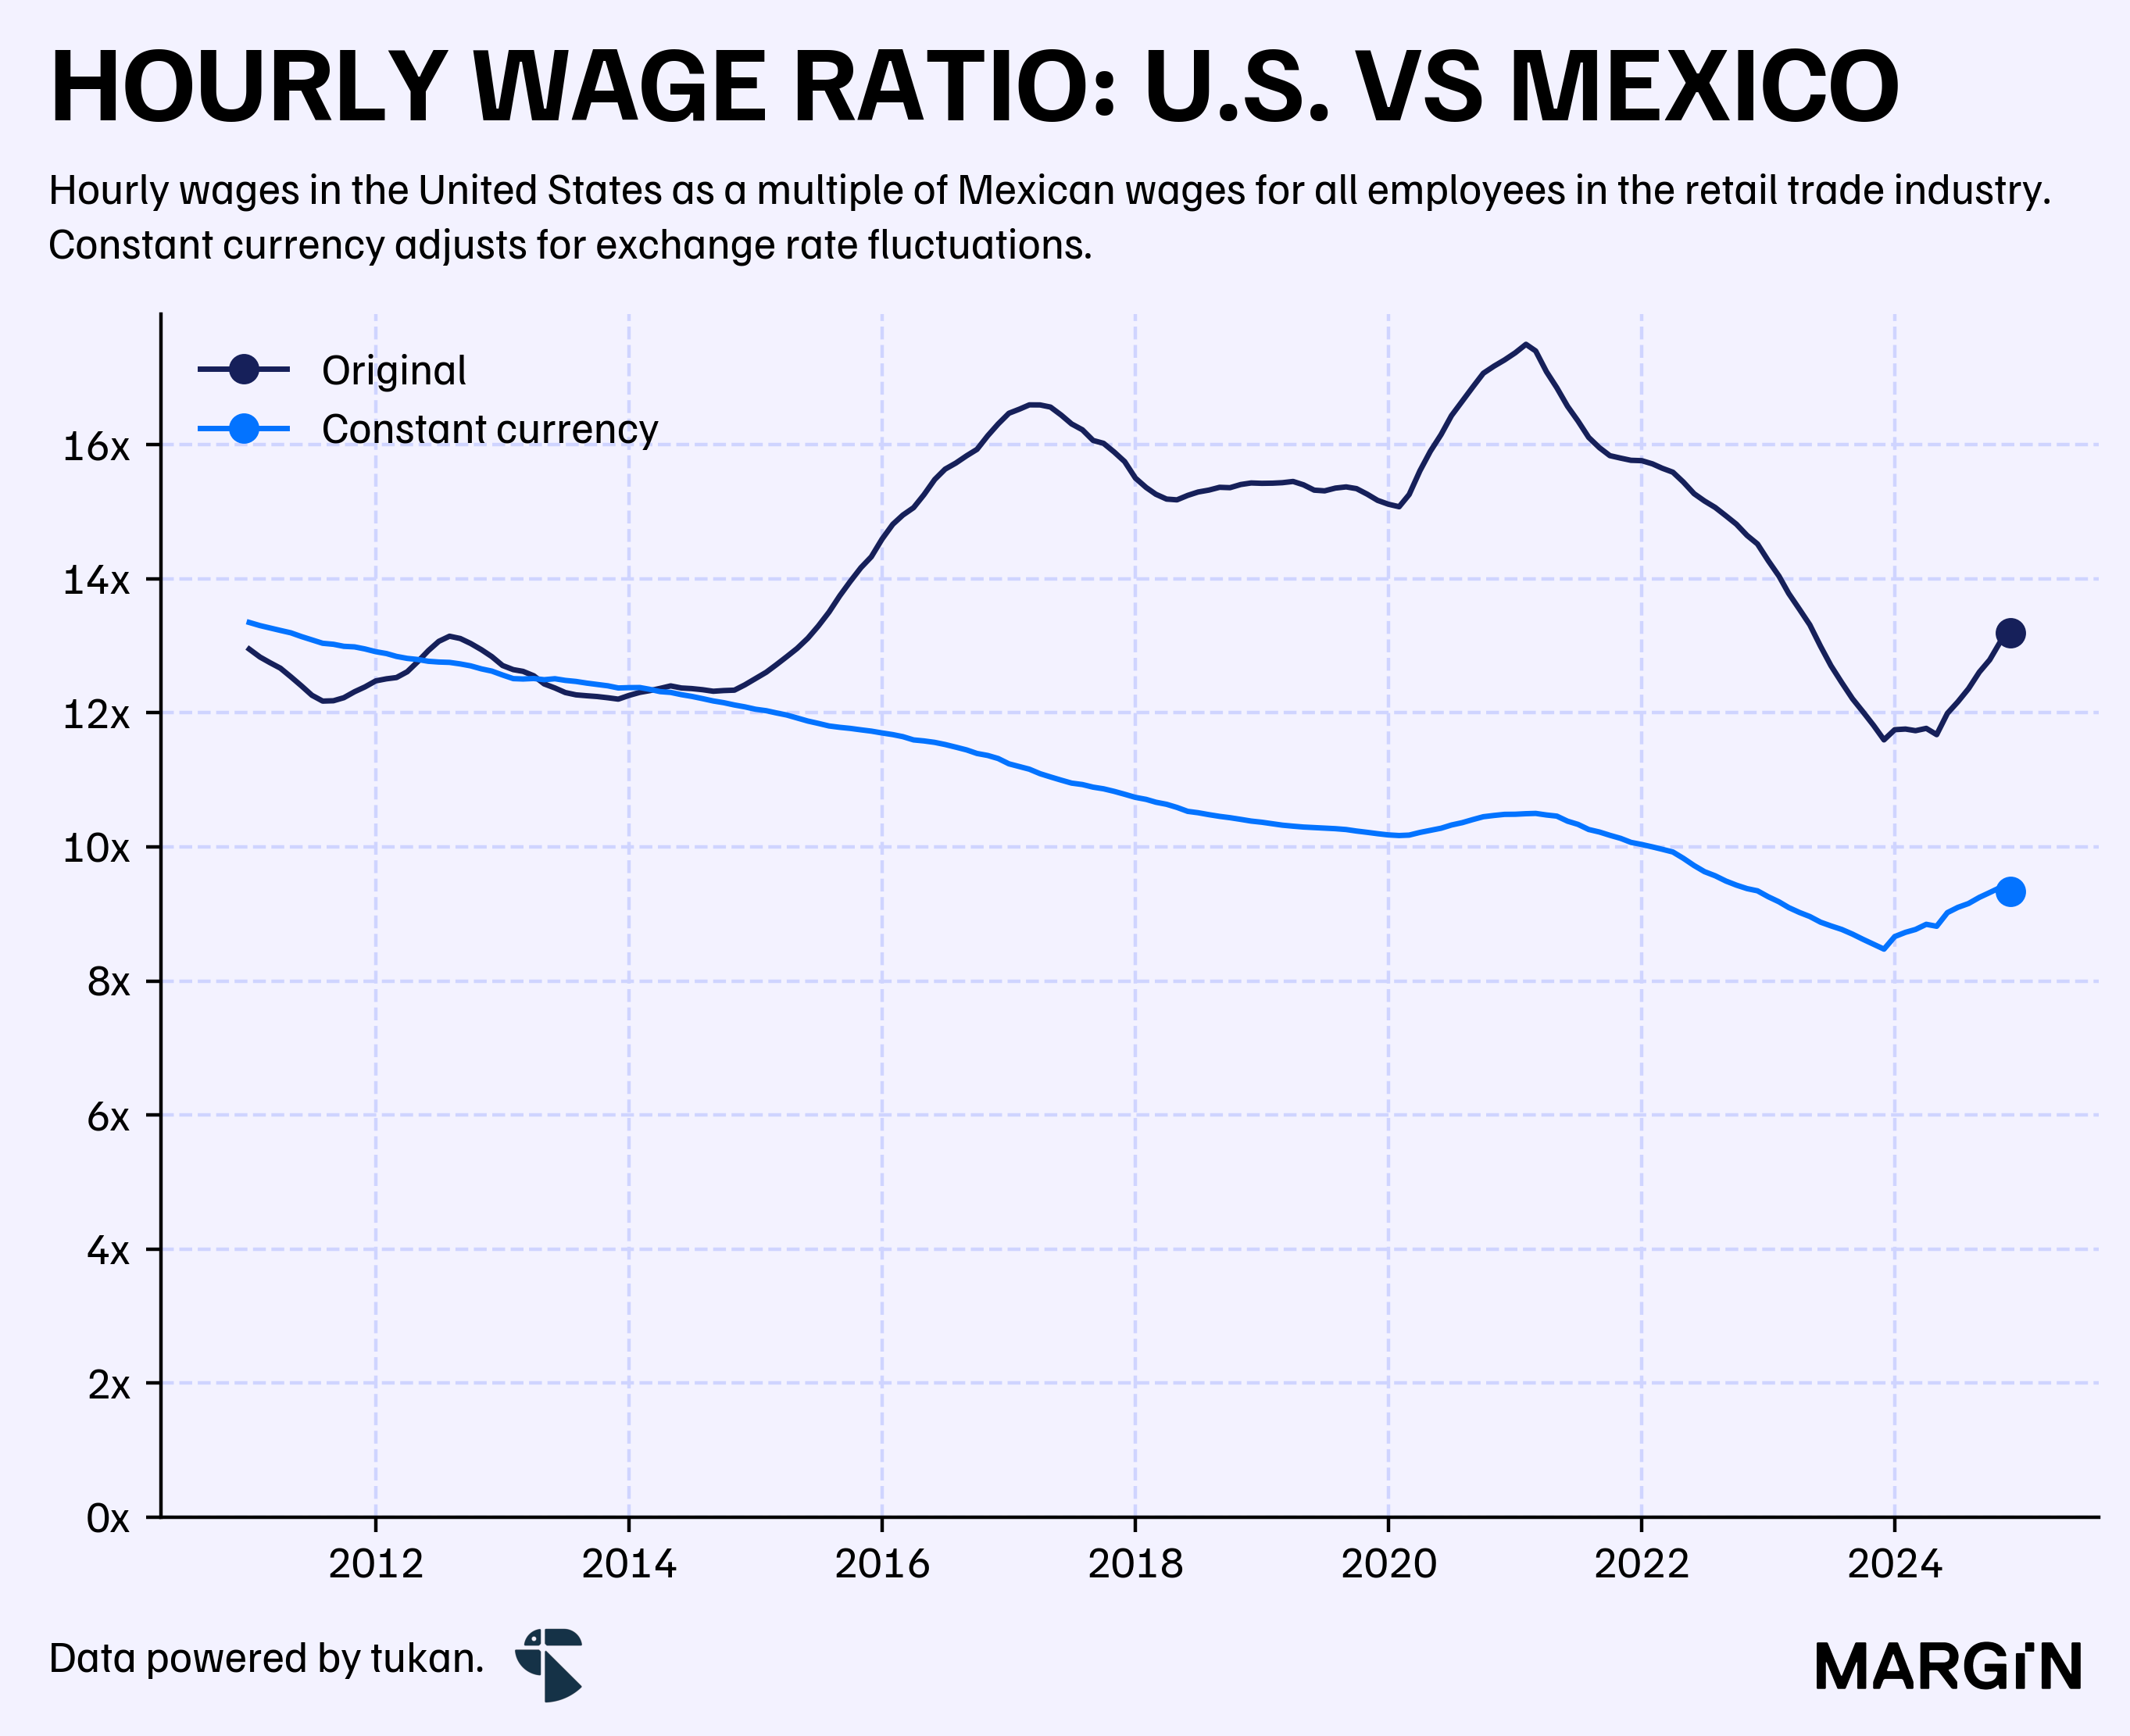
According to INEGI and BLS data, the average compensation for an American employee in the retail industry was 13 times higher than for a Mexican employee — a gap that’s been tightening considerably if we exclude for foreign exchange rate fluctuations.
This ratio measures compensation for all employees in the retail industry, not only blue collar workers.
We estimate that this would allow the Mexican operation to employ 22% more associates per 100 square meters of total floorspace (3 per 100 sqm in Mexico vs. 2.4 in the U.S.).
More generally, the average annual operating cost per square meter of retail floor space was 35% cheaper in Mexico than in the United States — with the cost per square meter in Mexico coming in at $1,042 USD (versus $1,614 USD in the United States).1
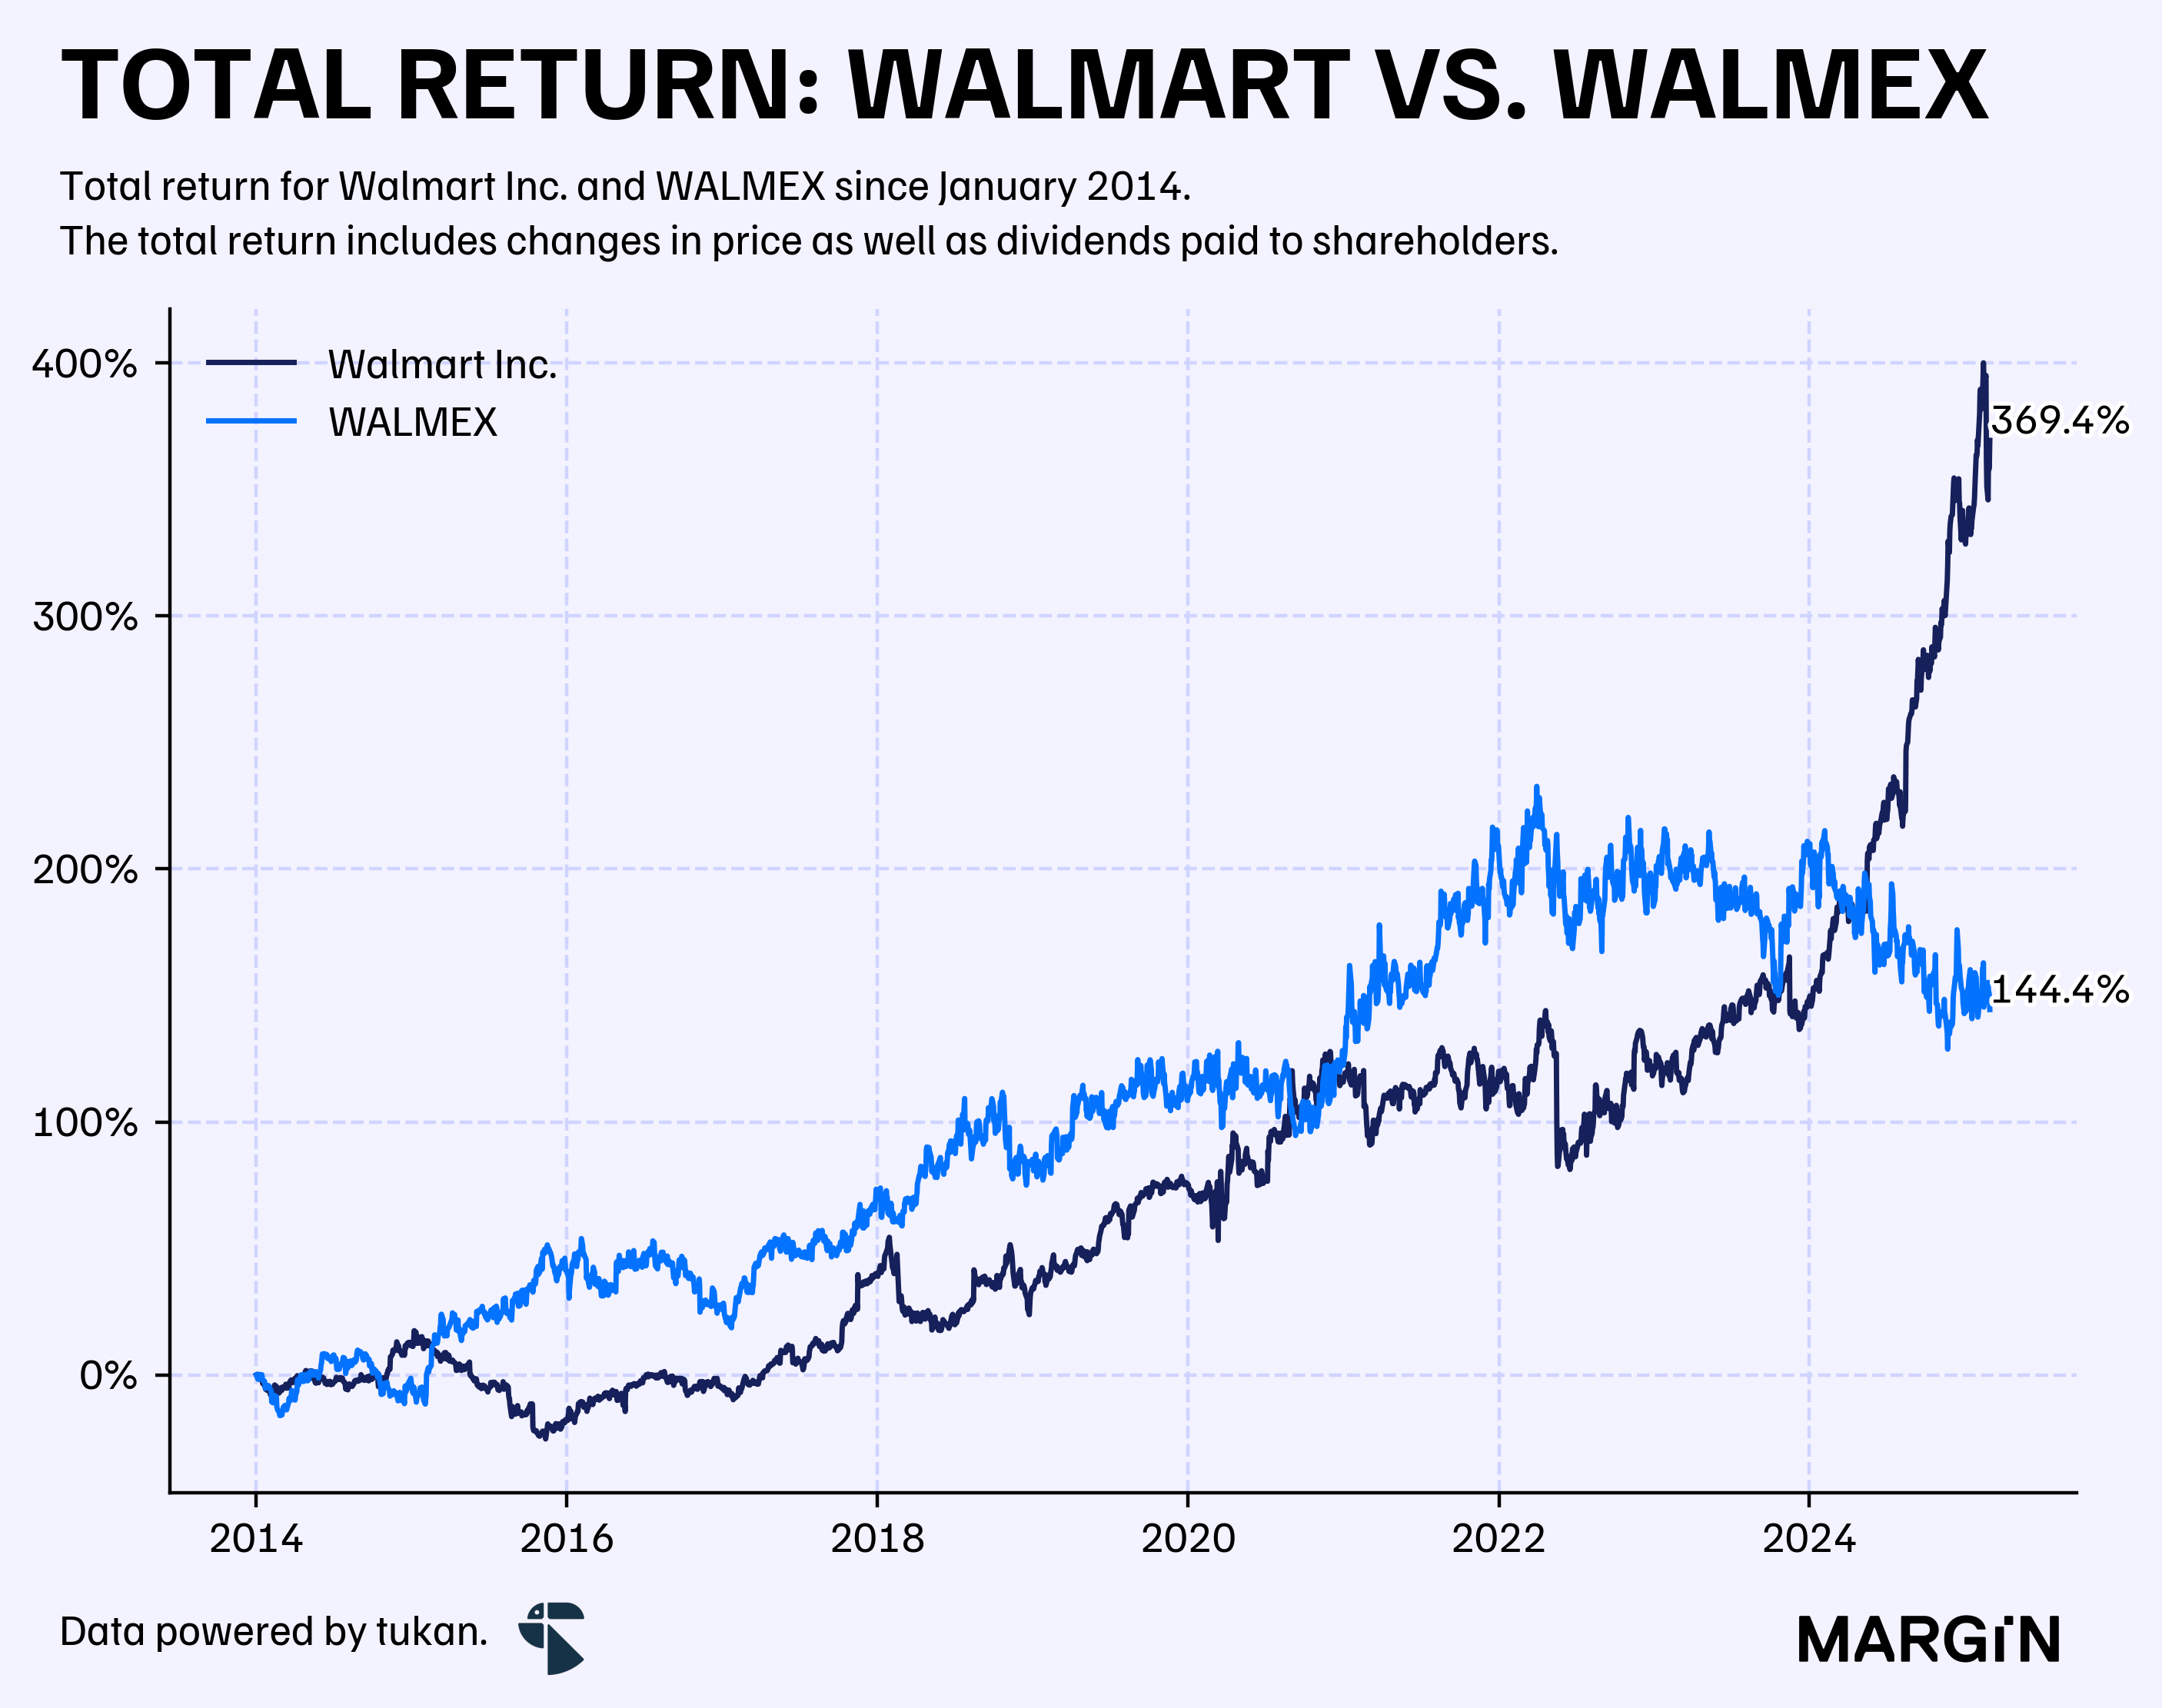
This important difference in efficiency seemed to translate quite well into WALMEX’s stock. Up until the early days of 2024, WALMEX consistently outperformed its holding in terms of total returns to shareholders.
However, that premium completely vanished over the past twelve months—a period in which Walmart Inc.’s shareholders have seen a total return of +70%, compared to a 17% contraction for the Mexican counterpart.
Apparently last year’s rise for Walmart’s stock has been primarily driven by the company’s market share rise in e-commerce, and the double digit rise in revenues from memberships and other income — despite accounting for just 1% of total sales.
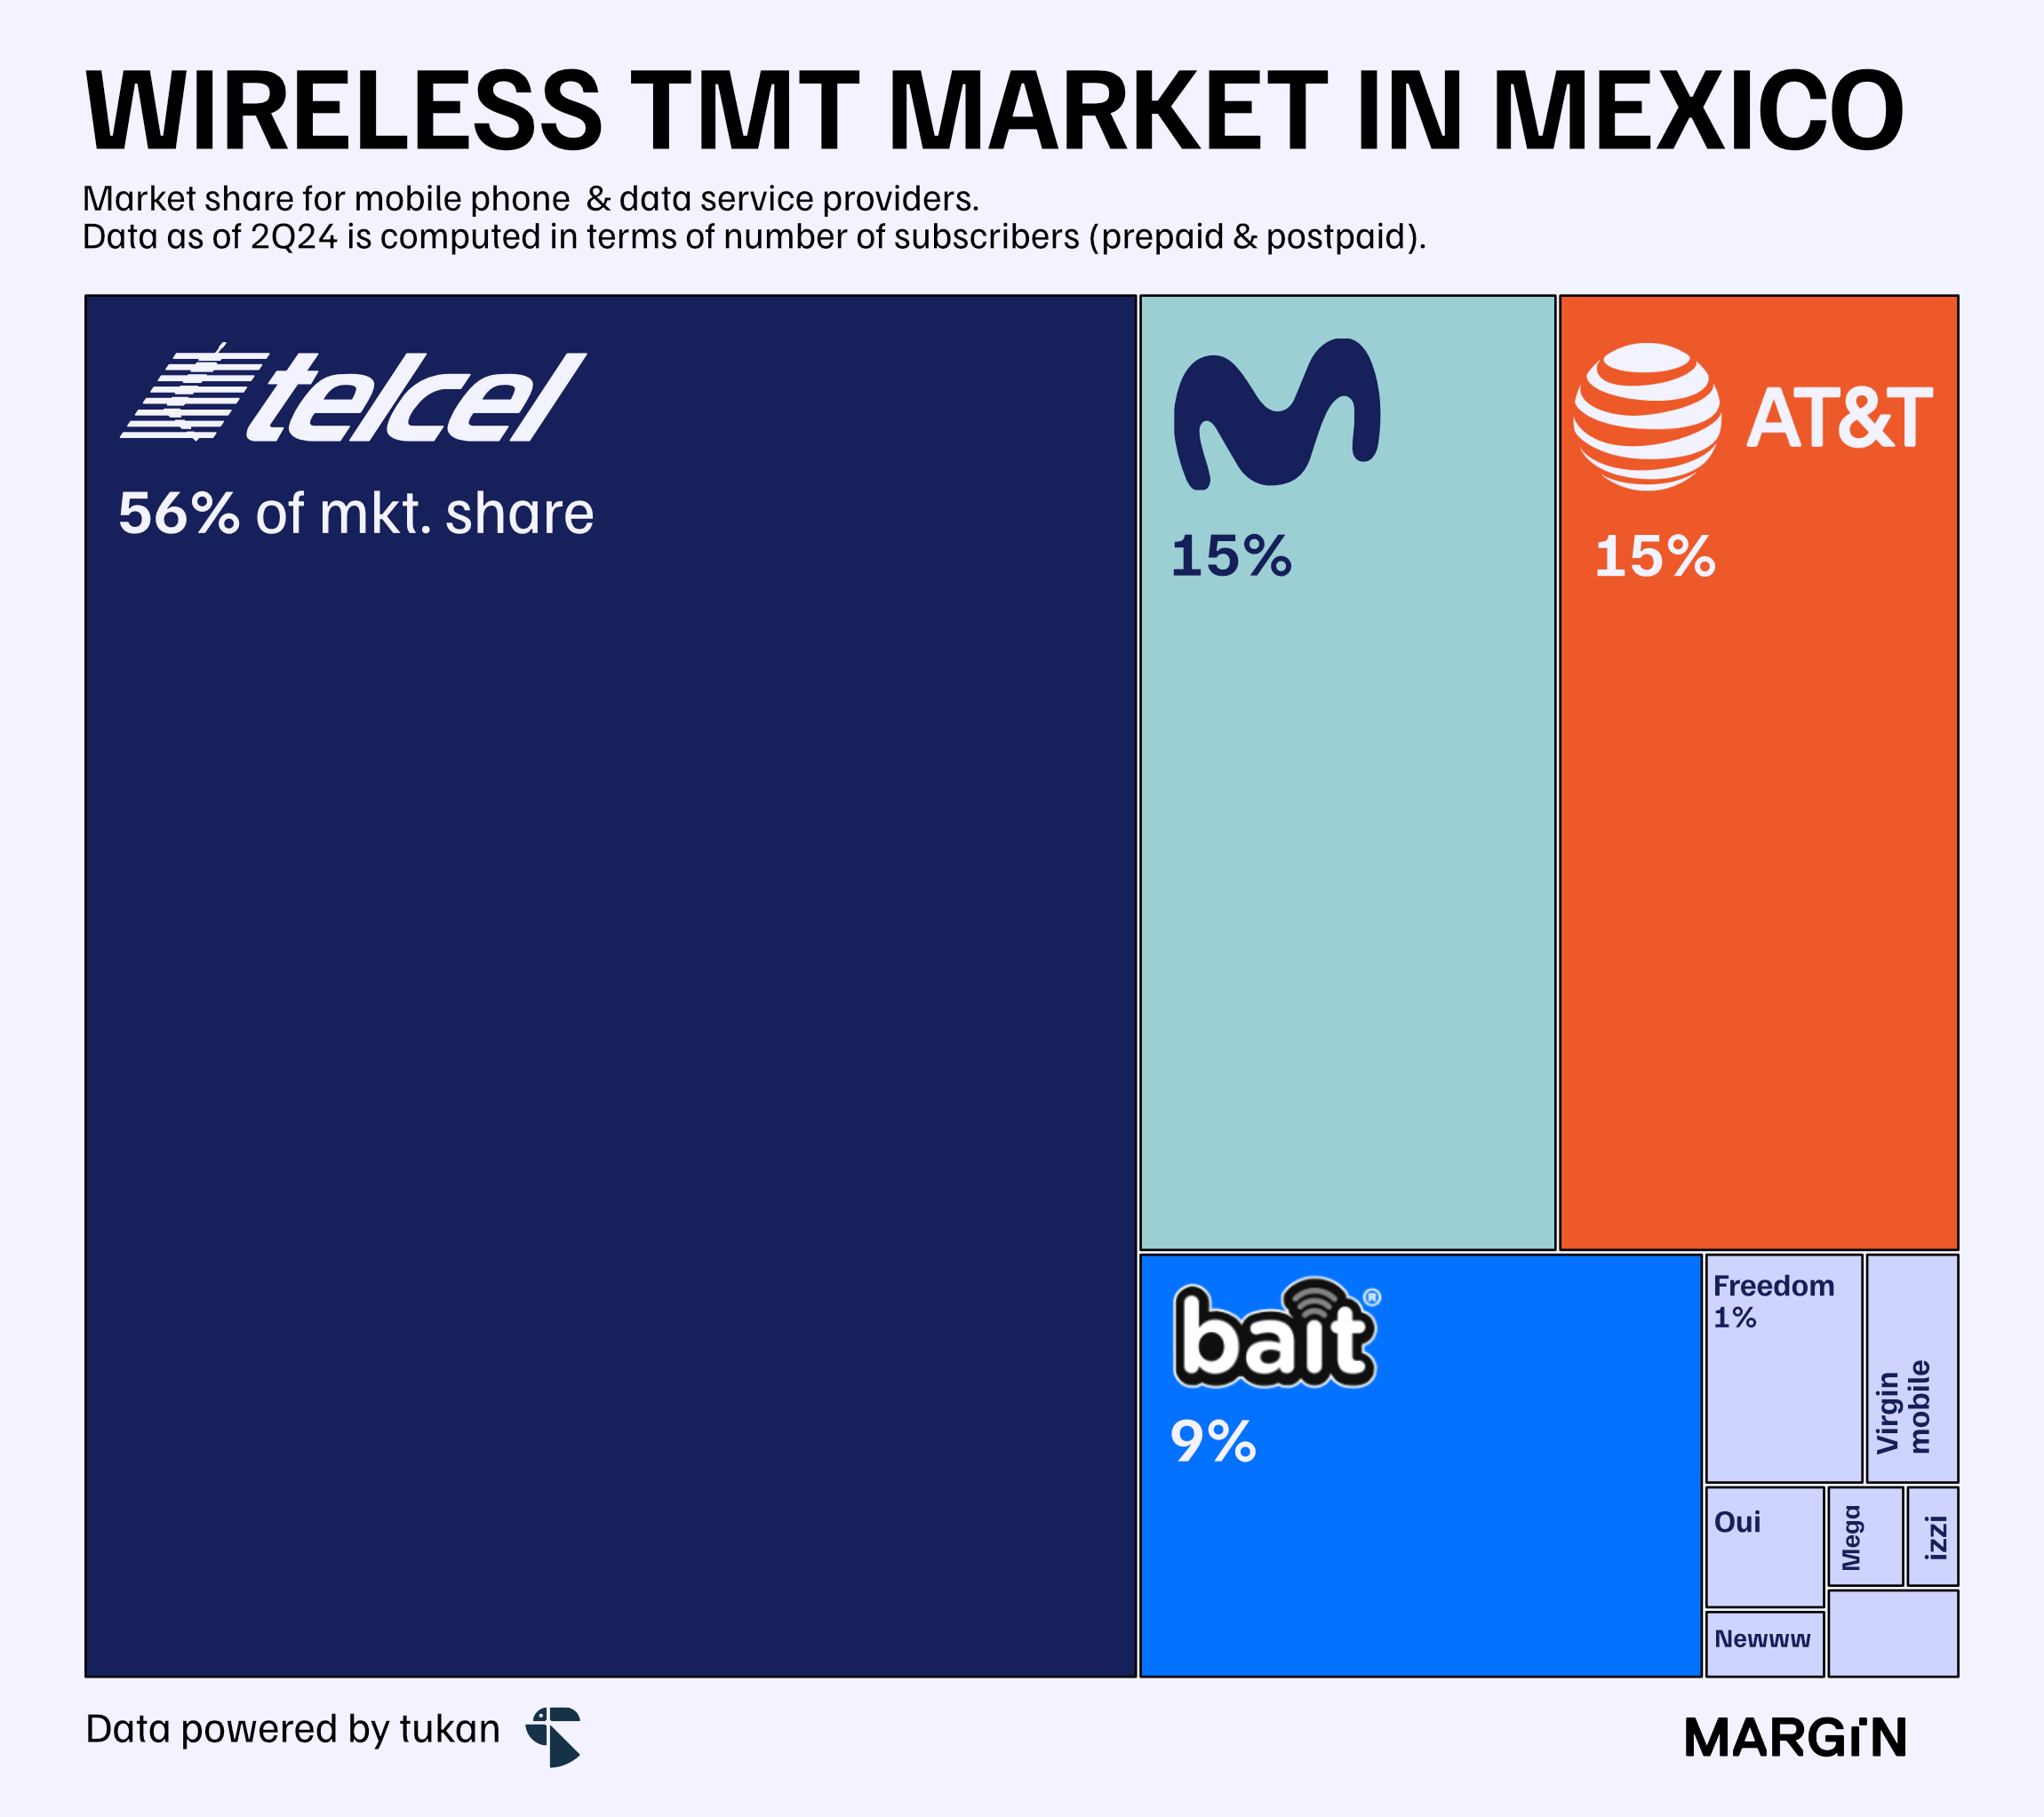
In Mexico, we believe that the company’s biggest business unit outside of the traditional retail operation would be the company’s wireless telephony service: Bait — which, according to IFT data would now have a 9% market share in the space and revenues close to the $6 billion peso mark (i.e. 0.6% of the company’s total revenues).
Most likely, Mexico will continue to remain as a compelling market for Walmart’s long-term strategy.
If the company will use investments to continue leveraging the deeply embedded cost advantages in the country to protect its brick and mortar market against smaller-format discount store competitors; or instead, it will use funds to develop e-commerce, TMT and financial service initiatives remains to be seen.
Operating expenses divided by the country’s total floor space.