Pressure
How inflation hits hardest on low-income households.
As we celebrate one year since we began publishing Margin, we decided to make today’s edition free to all of our subscribers.
If you enjoy it, consider purchasing a subscription. Paid subscribers allow us to continue developing this type of content and make better research for you on a weekly basis.
Probably one of the most important and closely monitored indicators worldwide, inflation data typically guides decision-making on interest rates. However, we have rarely analyzed inflation from the consumer's standpoint. How do families actually feel the change in prices day-to-day?
According to a recent study by IMCO, inflation stands out due to its regressive impact on the population, disproportionately affecting households with lower income levels during periods of high volatility.
For example, the chart below shows adjusted inflation rates based on each household income’s consumption patterns. As of October this year, Mexican households in the first income decile bracket have experienced a cumulative price increase of over 77% over the past 10 years—a rate almost 7 percentage points higher than those at the top of the income pyramid.1
During most of the pandemic, lower-income households suffered the most from dramatic price increases for consumption goods. In fact, during the third quarter of 2022, annual inflation rates for households within the lowest three income brackets exceeded 10%.
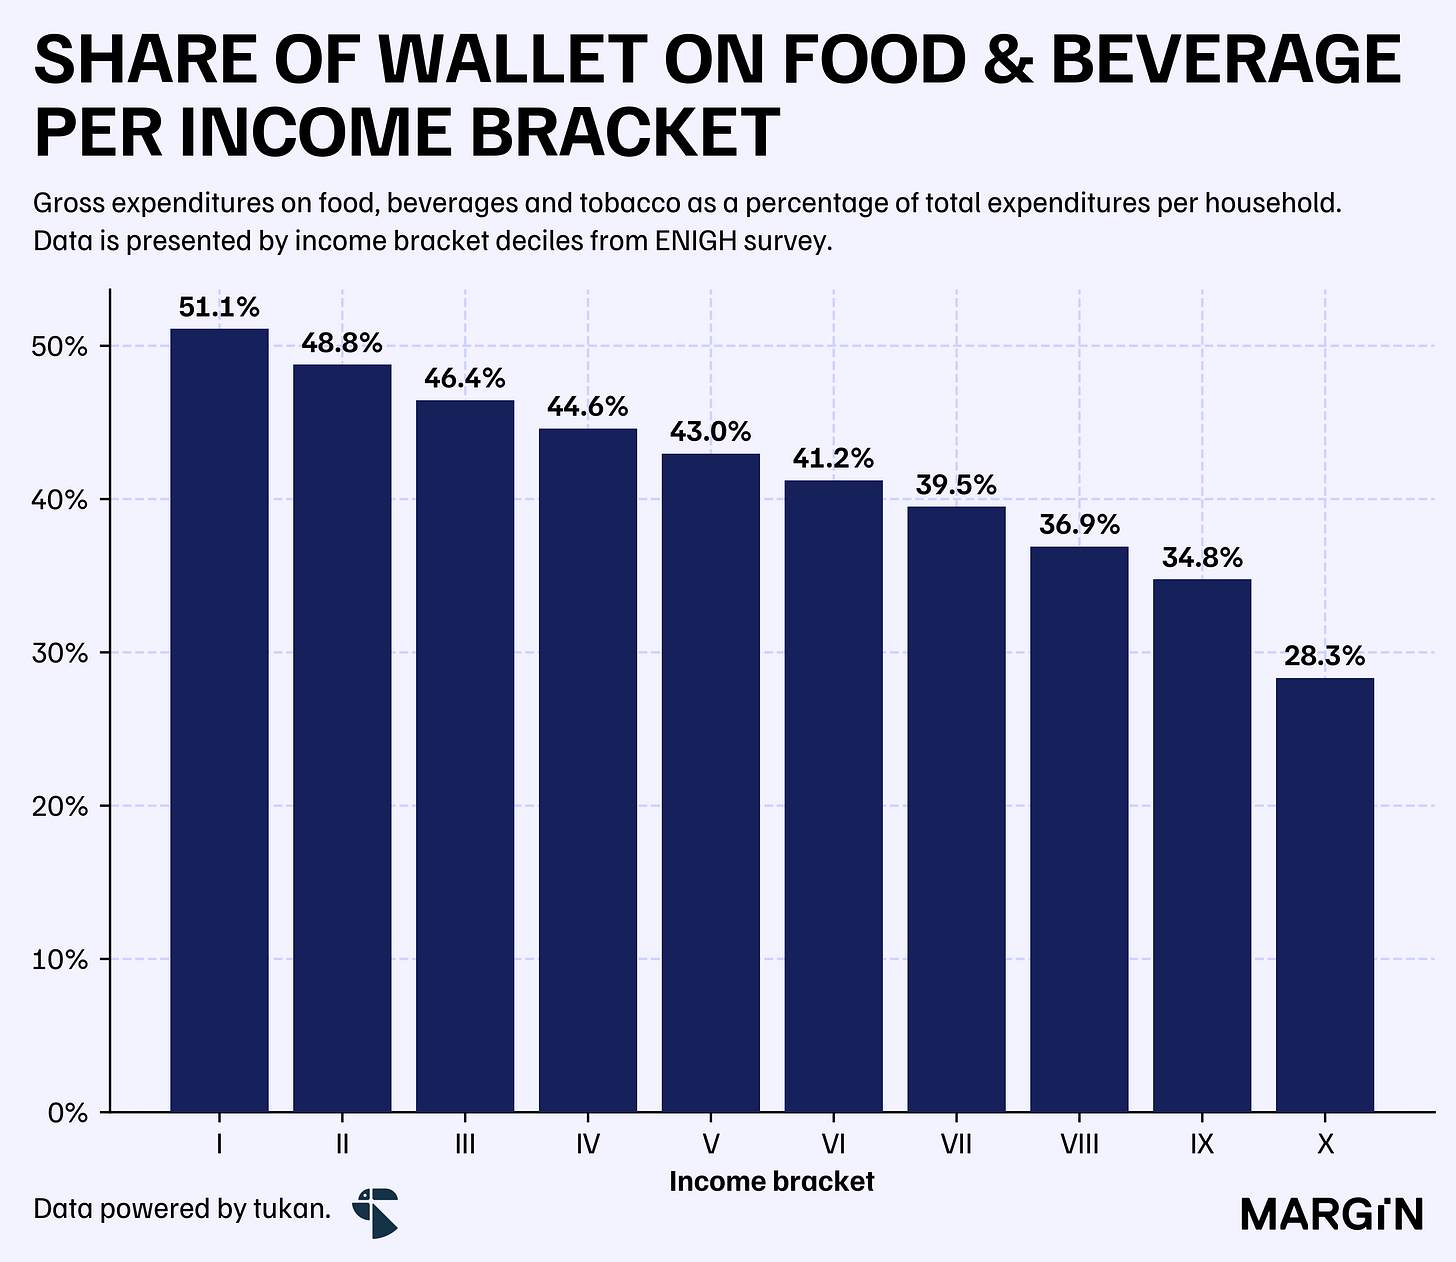
Much of this disparity comes down to the higher share of income allocated to food and beverages by households with fewer resources. According to the latest ENIGH survey from INEGI, households in the first income decile allocate about half of their spending to food, beverages, and tobacco. In contrast, these products account for less than 30% of the spending by households in the tenth decile.
Not only that, but as opposed to higher income families in the country, who spend +20% of their food & beverage budget on eating outside of home; most families at the bottom or middle of the income table2 spend just between 8% - 15% of their monthly income on this category; therefore, exposing them to stronger impacts on volatile products used to cook food at home such as cereals, eggs and vegetables.
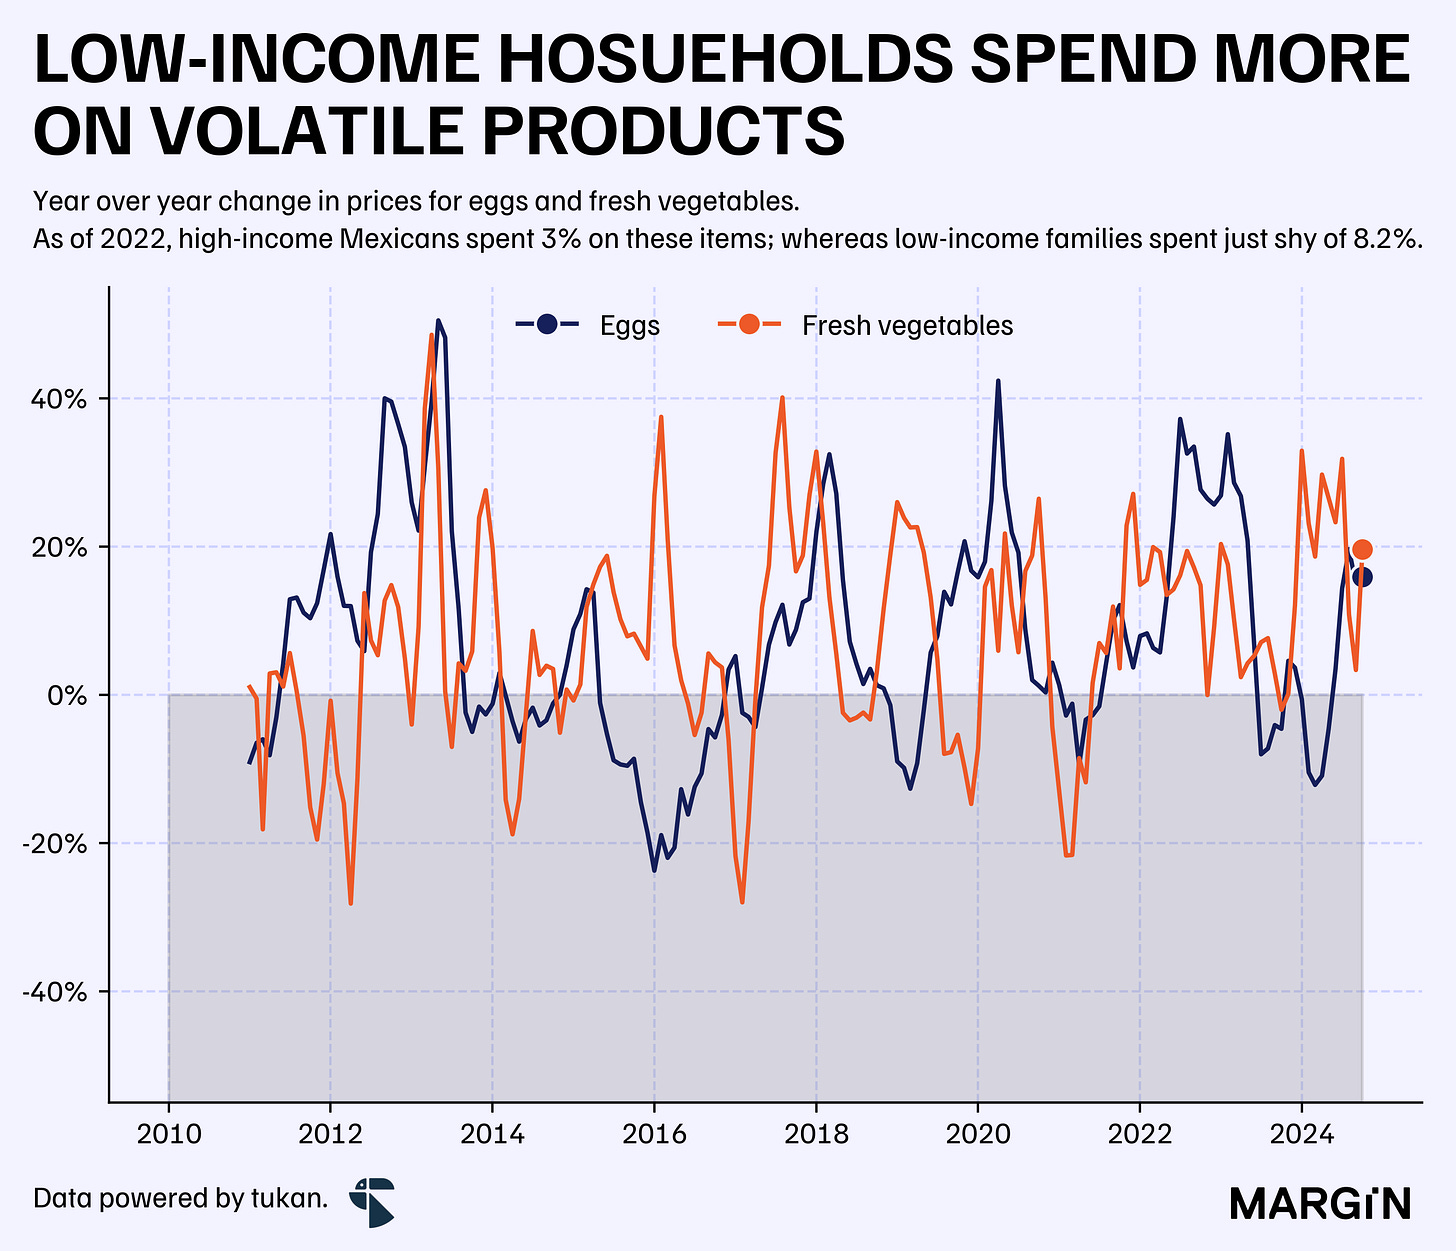
Take eggs and fresh vegetables as an example.
According to INEGI data, households within the three lowest income brackets spend 8.2% of their overall income on these two products alone — high-income households on the other end spend just slightly above 3.0%.
In the past 5 years, these products have seen annual price increases of +30% in more than 5 ocassions.
On top of a higher share of wallet for food and beverage products, lower income households also spend more on fuels and electricity — a category also known for its drastic price volatility. However, in this space the expenditure gap between low and high income families is much smaller at just 2 percentage points.
On the other end, wealthier families in Mexico tend to spend more on categories such as: recreational and education services. As of the latest ENIGH survey, these categories accounted (on average) for 11% of total monthly expenditures across the top three decile income groups. Low-income families on the other end spent slightly more than 5% across these categories.
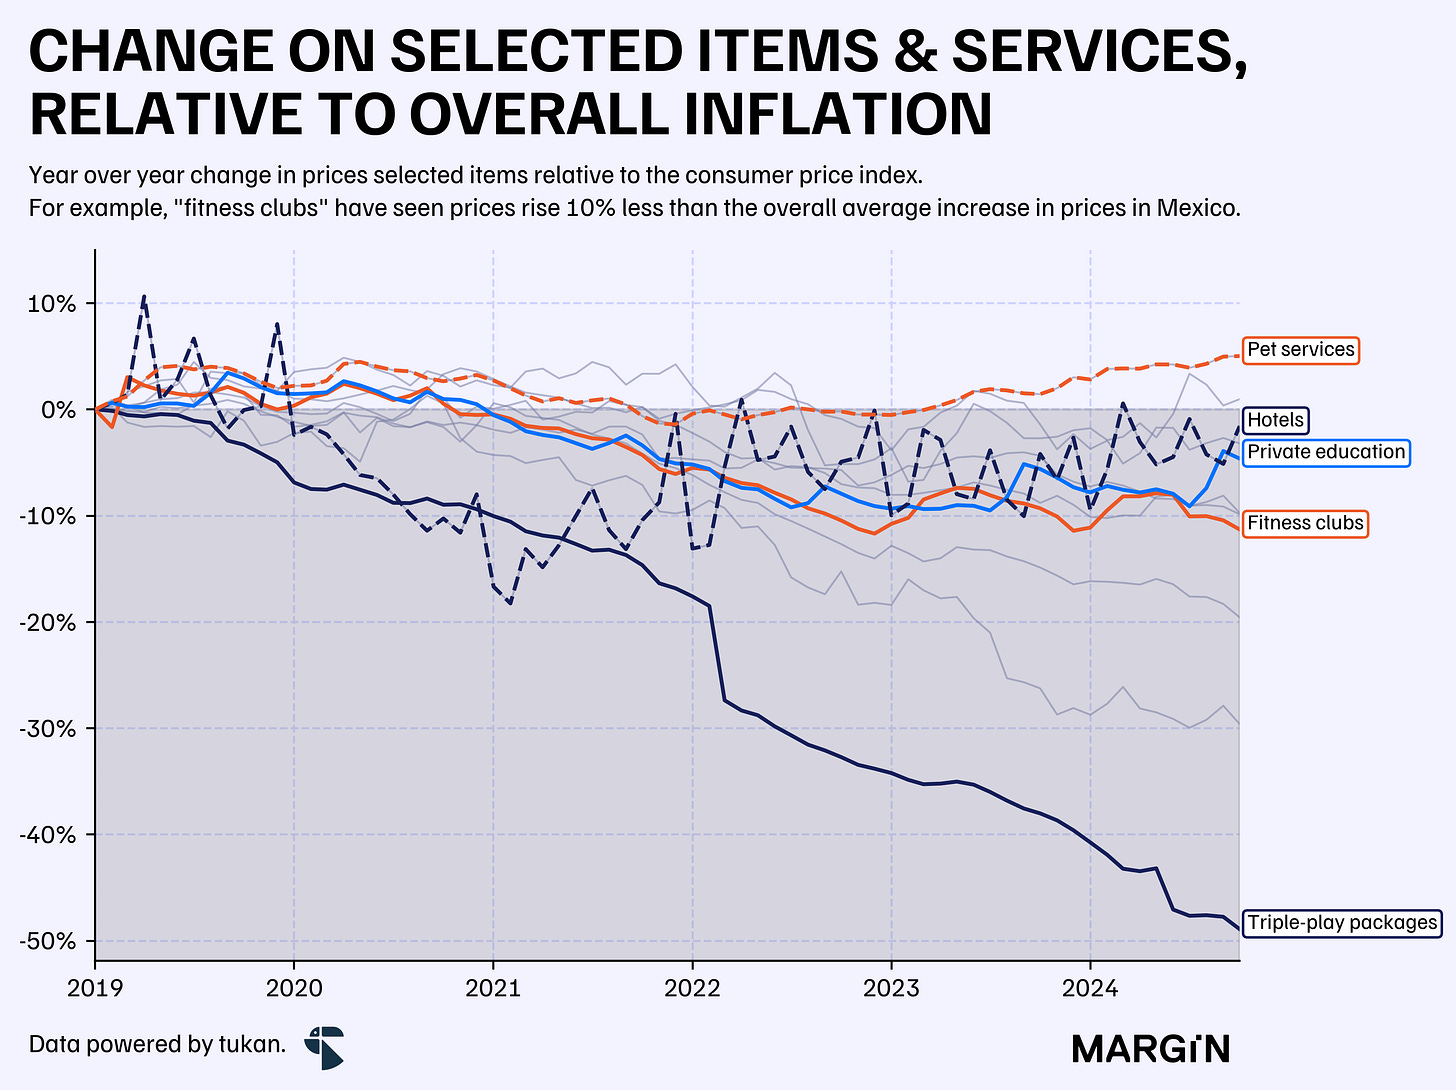
Curiously, price increases across these two categories have considerably lagged overall cumulative inflation since the start of 2019. In particular, these categories include products such as: internet, phone and paid television subscriptions, private education, fitness clubs, and hotels.
It’s also interesting to see how change in consumption patterns is directly reflected on product prices, even at an aggregate level, from INEGI data.
Fitness clubs, hotels, and private education were all sectors hit hardly by the consumption pattern changes initiated by the pandemic. Prior to 2020 their overall pricing for consumers moved in line with market prices, and despite some recovery, most still lag the overall market index.
As a whole, it’s clear how lower income households tend to receive the impact of price rises more sharply due (on the most part) to their high exposure to more volatile products.
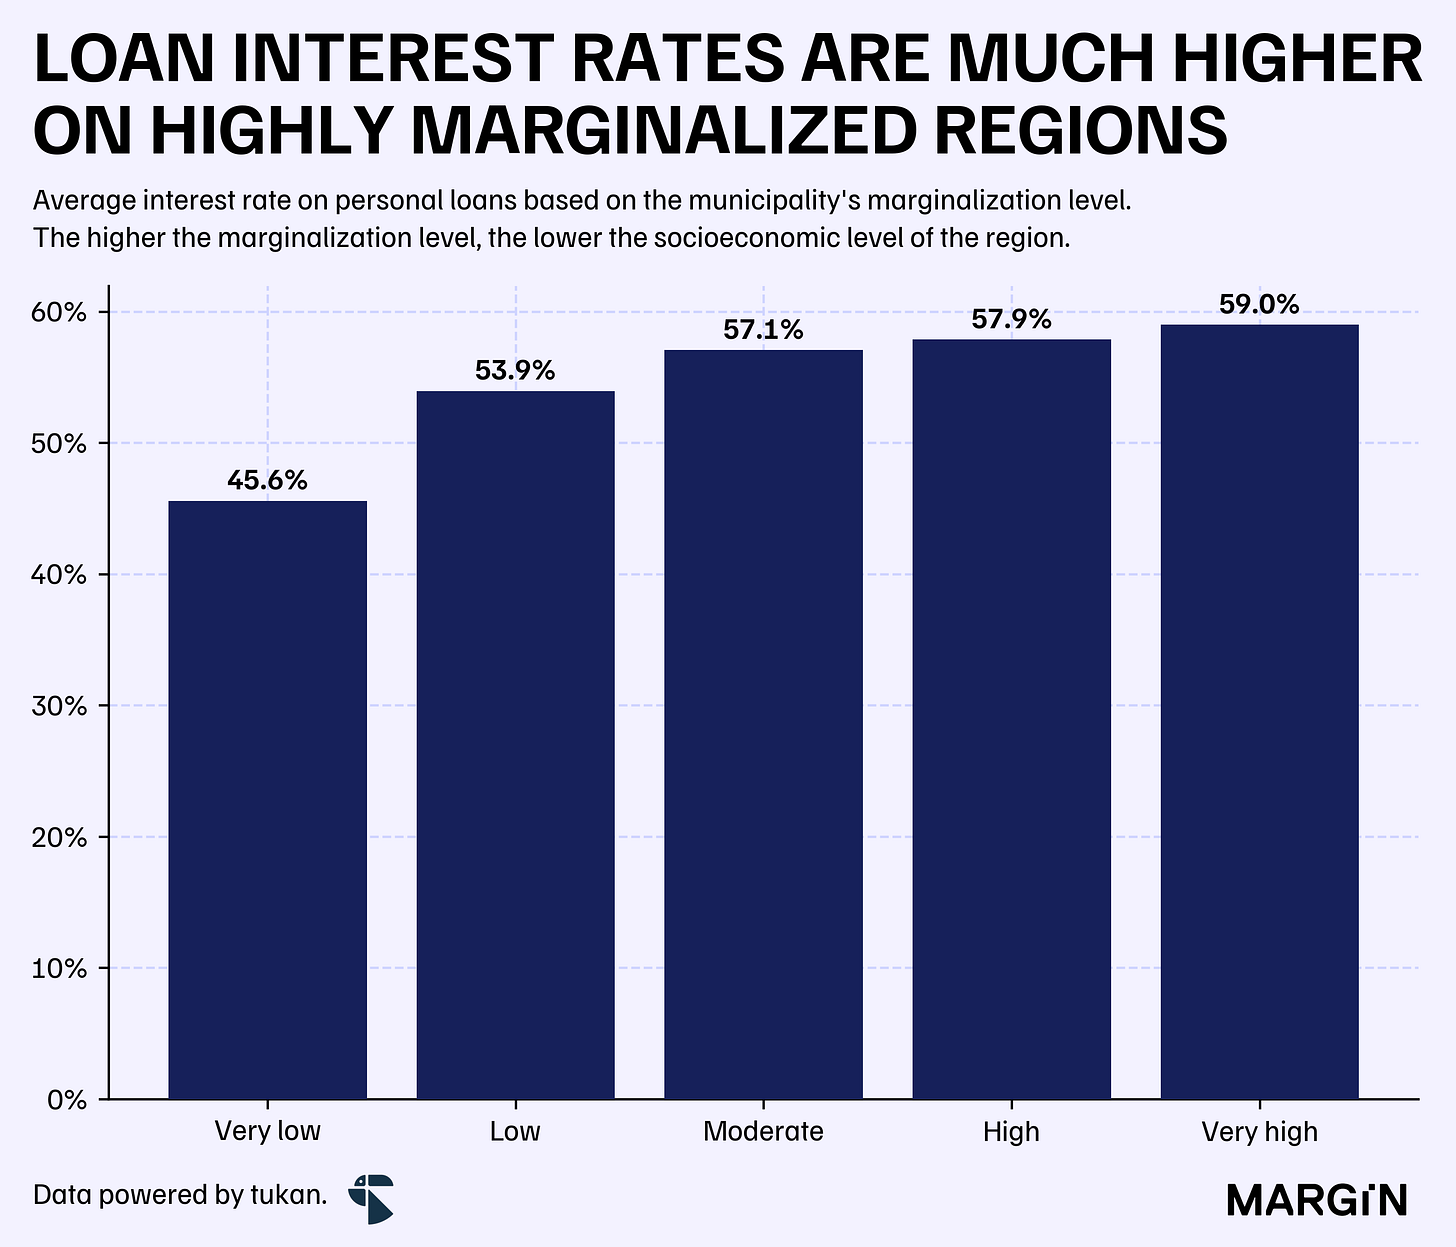
But what about other products that are not included in the INPC basket of goods, such as interest rate on loans.
According to data from the CNBV, personal loans on highly marginalized regions across the country tend to have a premium on interest rates of more than 14 percentage versus areas with low marginalization indices.
As expected, most personal loans granted by commercial banks are concentrated in regions where sociodemographic levels are high — i.e. low marginalization levels. As of August 2024, these municipalities concentrated over 70% of total loans, in terms of loans granted.
For context, the percentage of loans that as of August 2024 were classified as non-performing (i.e. credit risk stage 3) in high or very high marginalized regions were of 4.5% and 5.5% — a ratio slightly higher than the 4.8% observed on the country as a whole.
In the end, how much more pressure will be placed on the wallets of low-income households across the country?
It’s important to note that even the source of the data, INEGI, points that the top decile in the country underestimates true income and expenditure patterns due to the enormous disparity between households at the top 5% of the curve and those at the top 10%.
The first decile being the exception.


