

Recap
Key stats from the third-quarter results in Mexico.

According to company filings, non-financial companies listed in Mexico, including those issuing corporate debt, recorded a 7.8% year-over-year (YoY) increase in their top-line revenue. Out of the 129 companies monitored, 59 posted double-digit growth rates during the quarter, while 29 reported contractions in their overall revenue.1

On a year-to-date (YTD) basis, median revenue growth for listed corporations reached 3.9%. On the left side of the plot, we find companies such as Homex, BeGrand, Grupo Simec, and Cultiba, which posted contractions exceeding 20% during the first three quarters of the year.
Conversely, at the right end of the distribution, we encounter companies like Vista Energy, Aristos, and Urbi, all boasting top-line growth rates of over 30% (YTD).

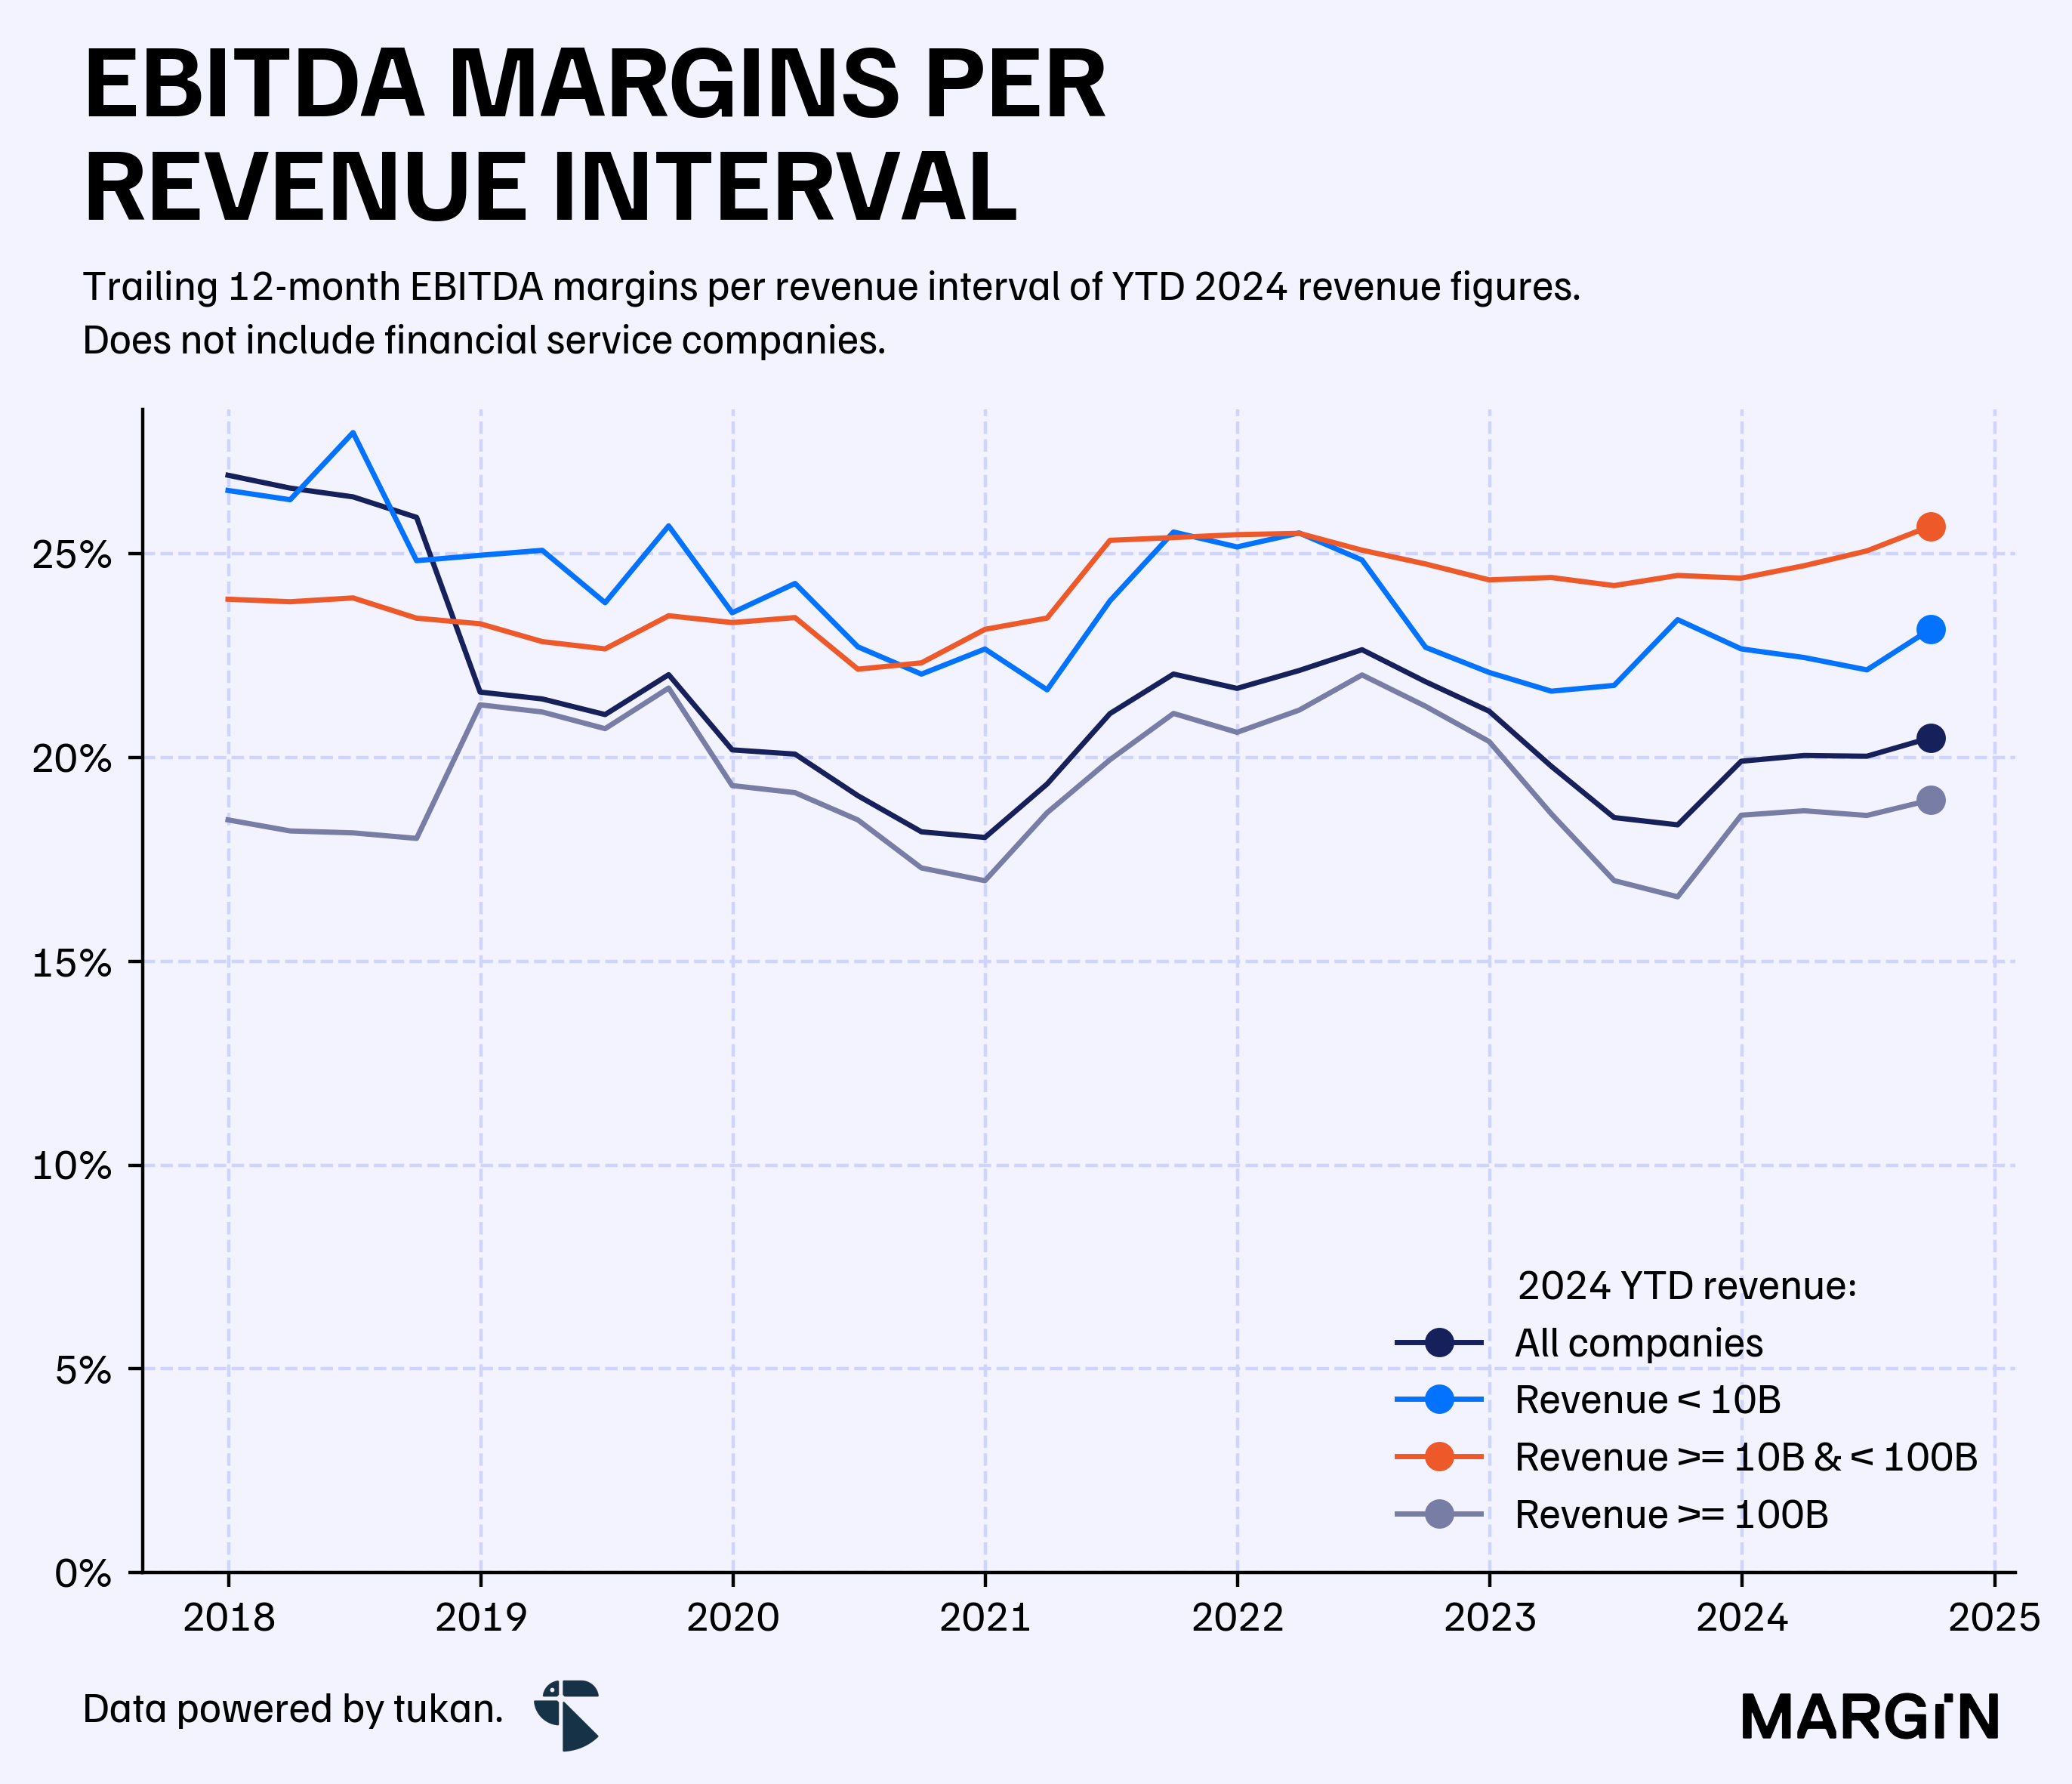
On the other hand, EBITDA margins expanded to 21% for the market as a whole—a ratio 54 basis points (bps) higher than the previous quarter and 178 bps higher compared to the same period in 2023.
Overall, EBITDA margins across revenue intervals continue to recover from the downturn observed in 2023.
According to company filings, nearly 6 out of 10 businesses that sold over $100 billion pesos during the first three quarters of the year posted EBITDA margin expansions. Notable exceptions include PEMEX and Orbia, both of which experienced margin contractions exceeding 200 bps.
In today’s Margin article, we reflect on the key results from listed companies in both equity and debt markets in Mexico during the third quarter of this year.
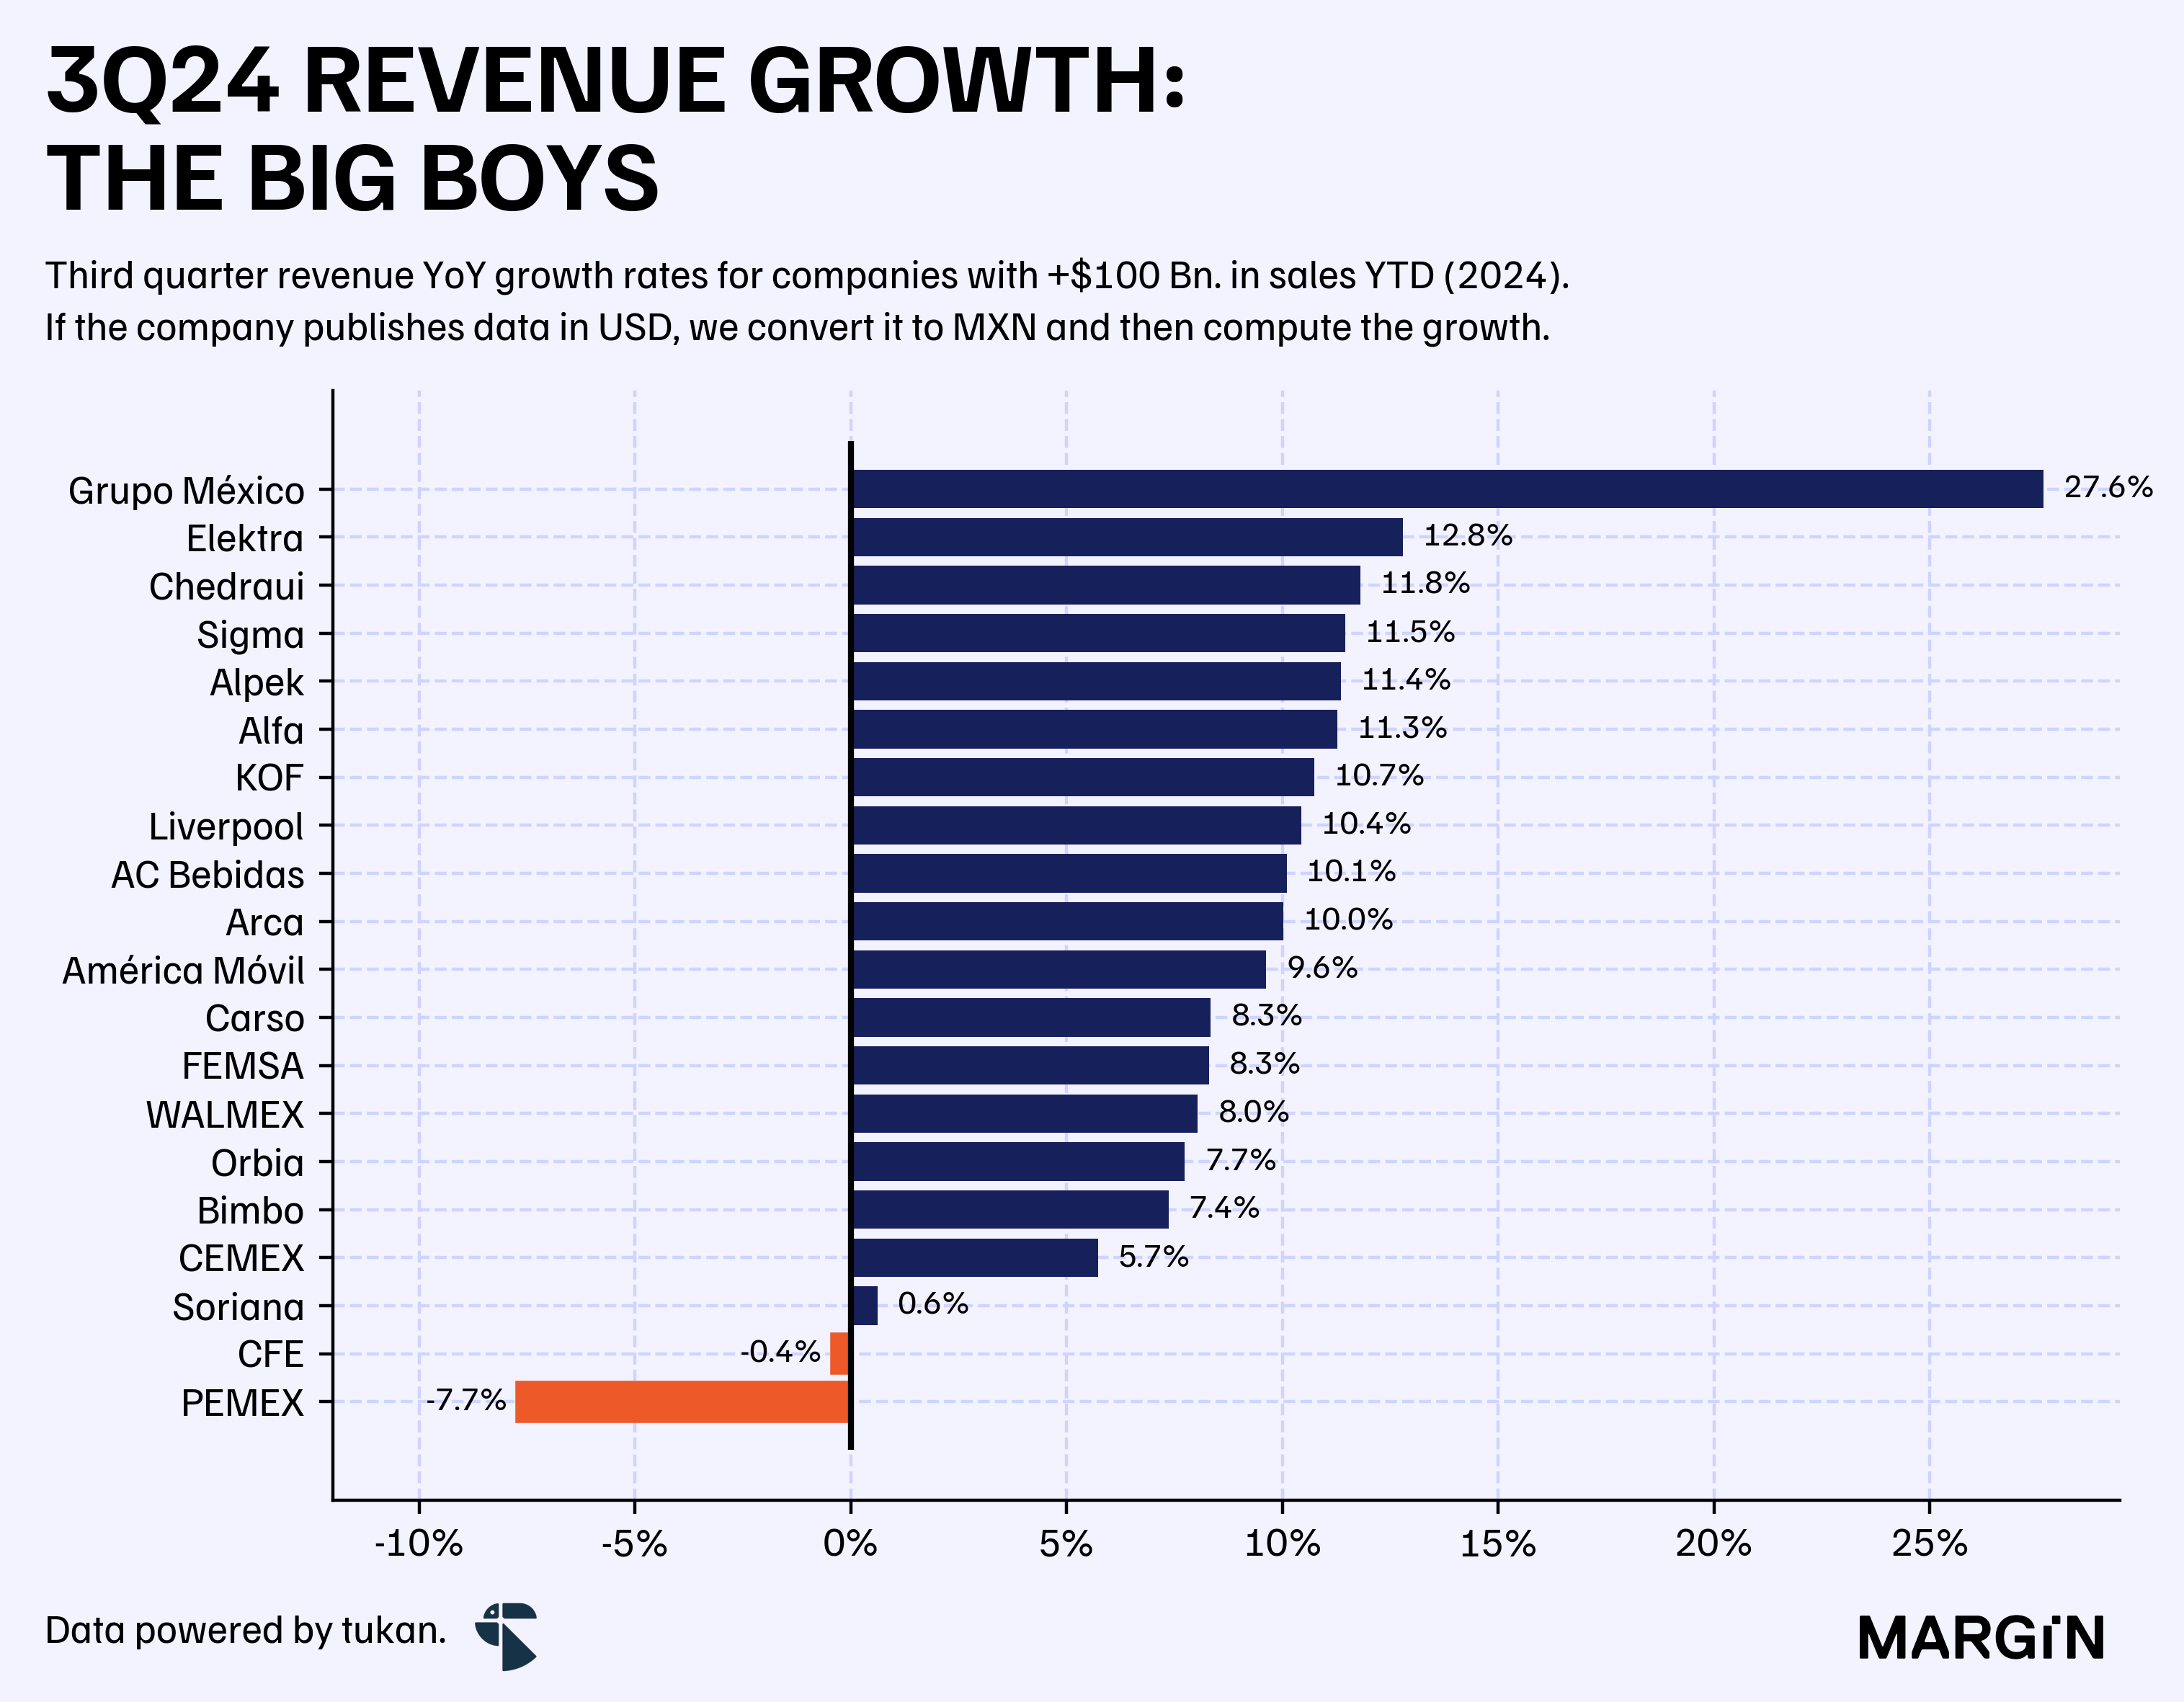
Focusing solely on third-quarter data and examining companies with over $100 billion pesos in revenue during the first nine months of the year, we see that the big winners of the group were Grupo México, Elektra, and Chedraui—all posting over 12% YoY growth during the quarter.
Conversely, only two companies reported contractions in their top-line numbers: PEMEX, with a decline of 7.7%, and CFE, with a slight decrease of 0.4%.
In terms of balance sheet health, the net debt to EBITDA ratio for “the big boys” closed 3Q24 at 3.3x, indicating slight leverage increases for the group. When excluding PEMEX and CFE from the analysis, the net debt to EBITDA ratio drops to less than 1.8x as of the end of September this year. However, this still represents a 14% increase in the leverage ratio compared to 2023 for these businesses on aggregate.
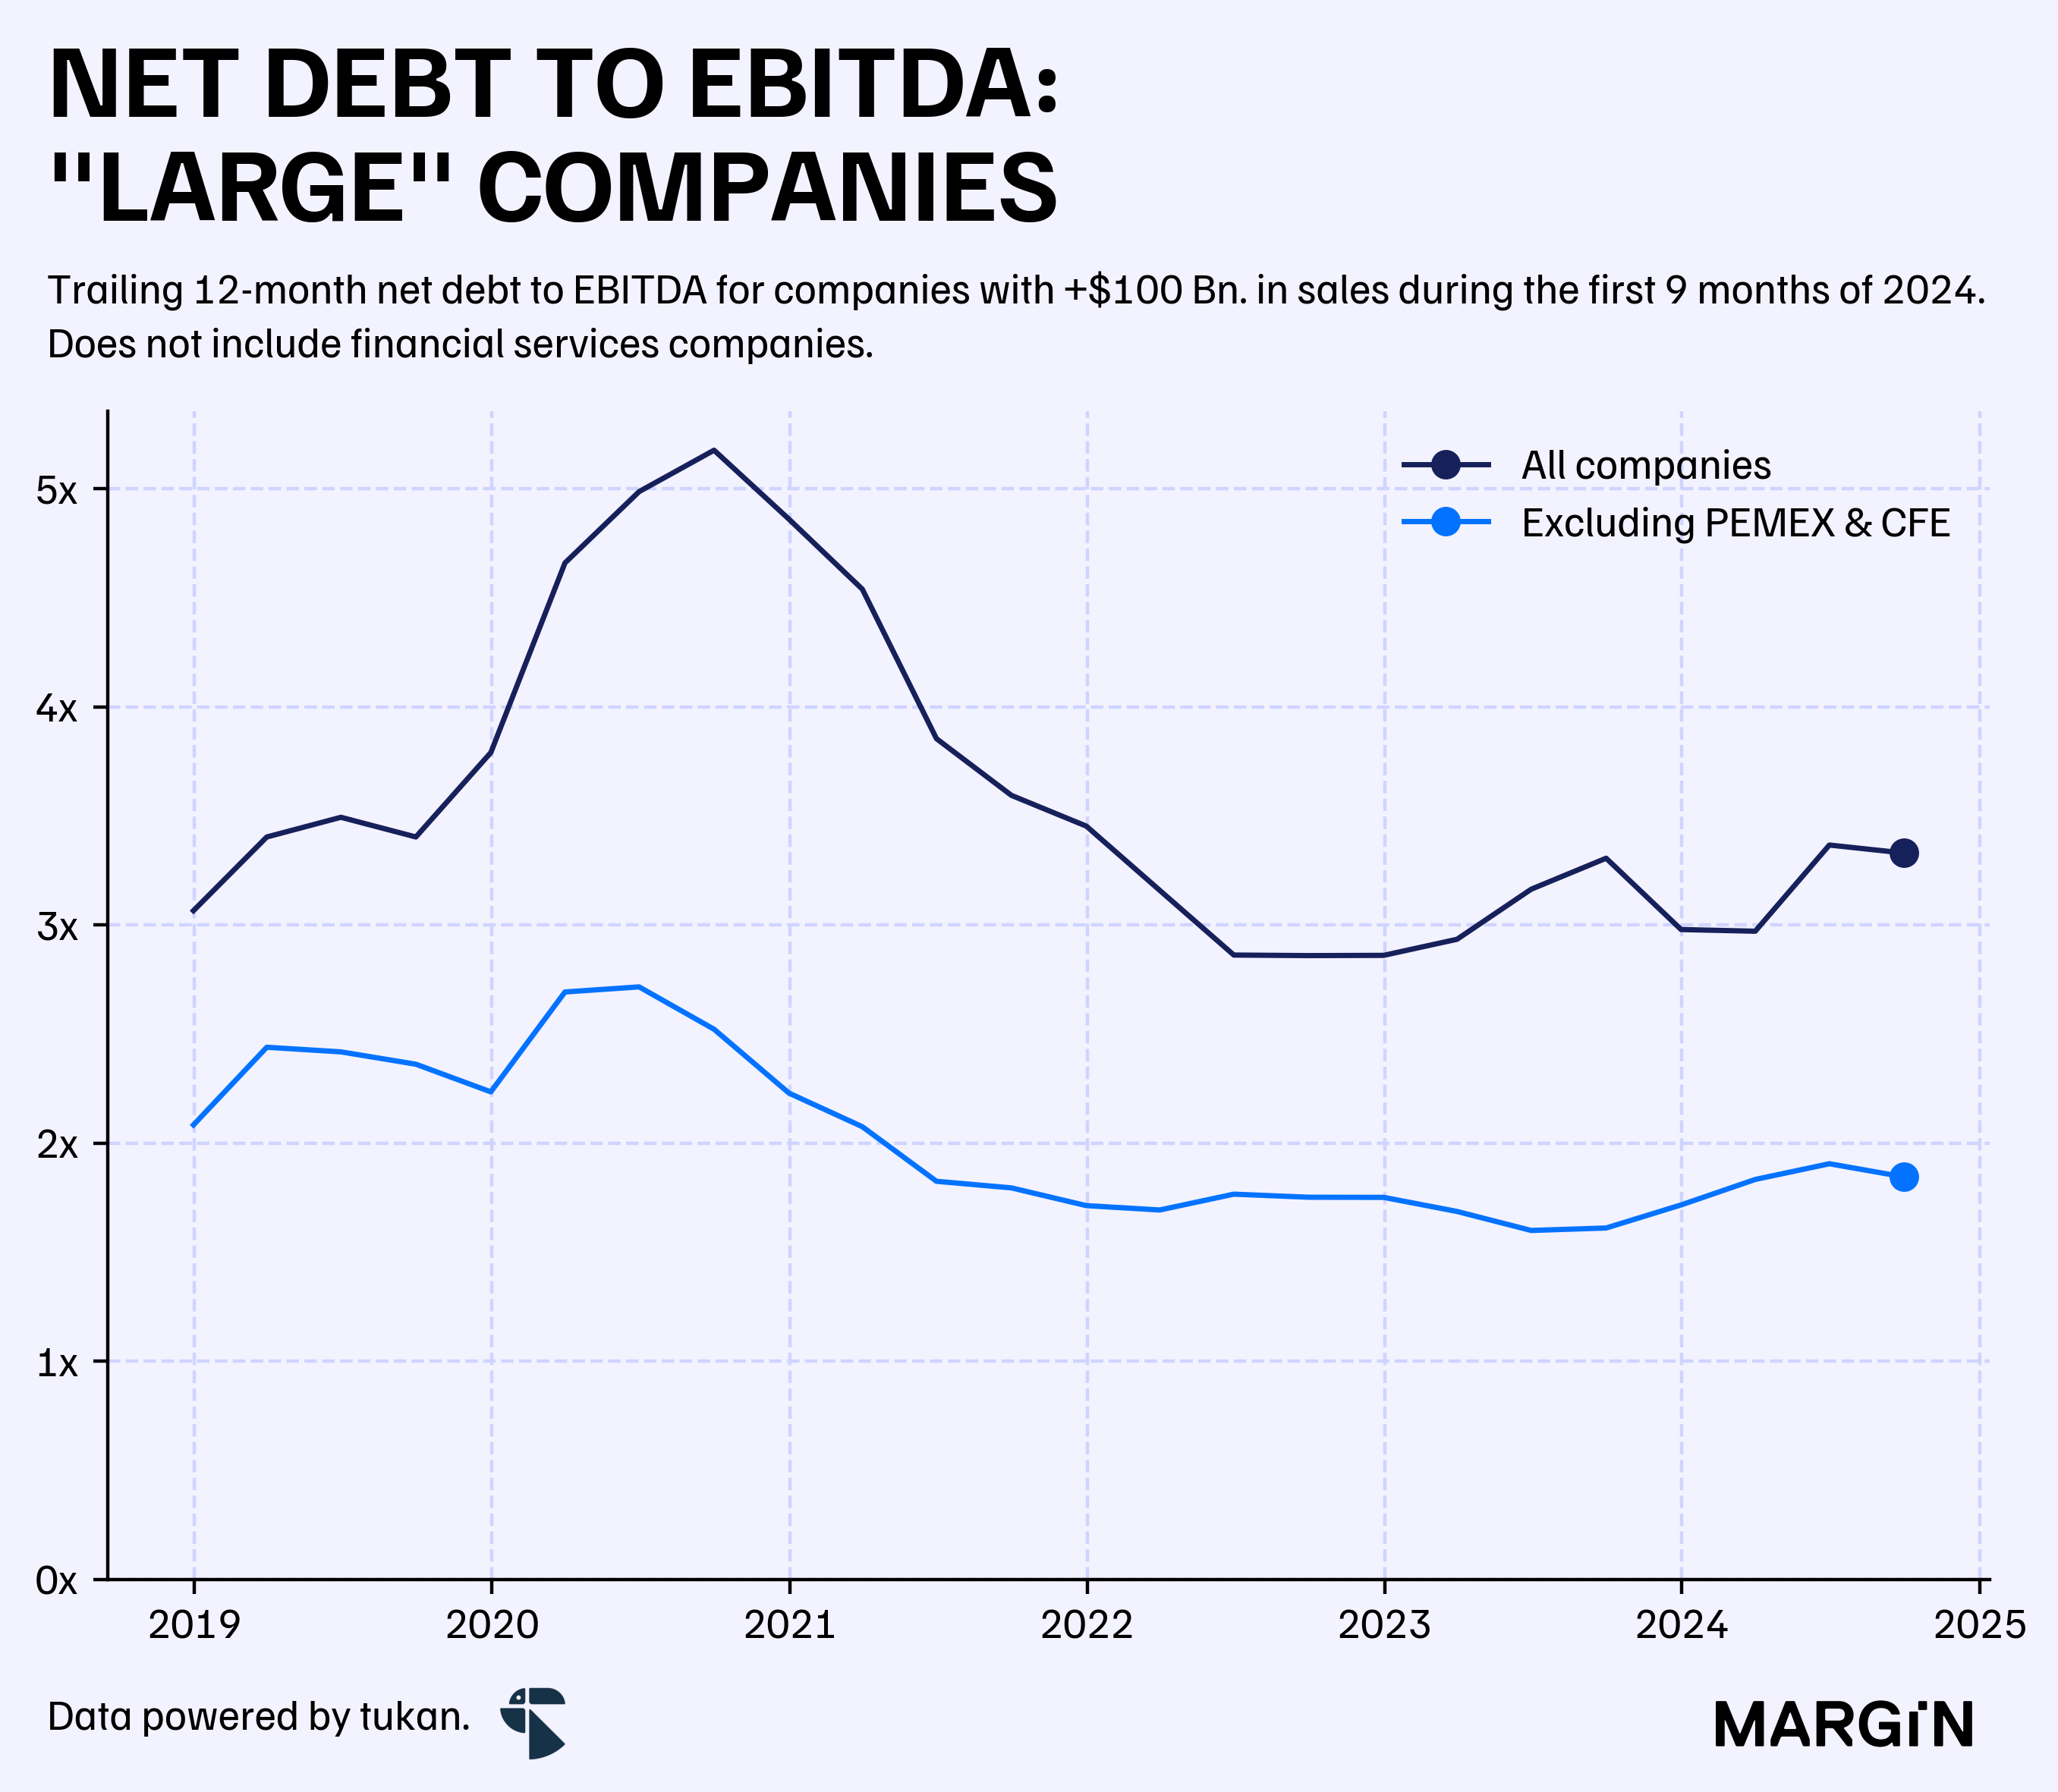
In fact, only 8 out of the 19 companies in this set posted contractions in their leverage ratios compared to last year. Orbia and Bimbo stand out within this group, as their ratios increased from 2.9x to 4.7x and from 1.9x to 3.1x, respectively.
Please note that our figures are based on the official data reported to the CNBV and do not account for adjustments made by the investor relations teams in the companies’ press releases. This may cause some ratios and figures to differ slightly.
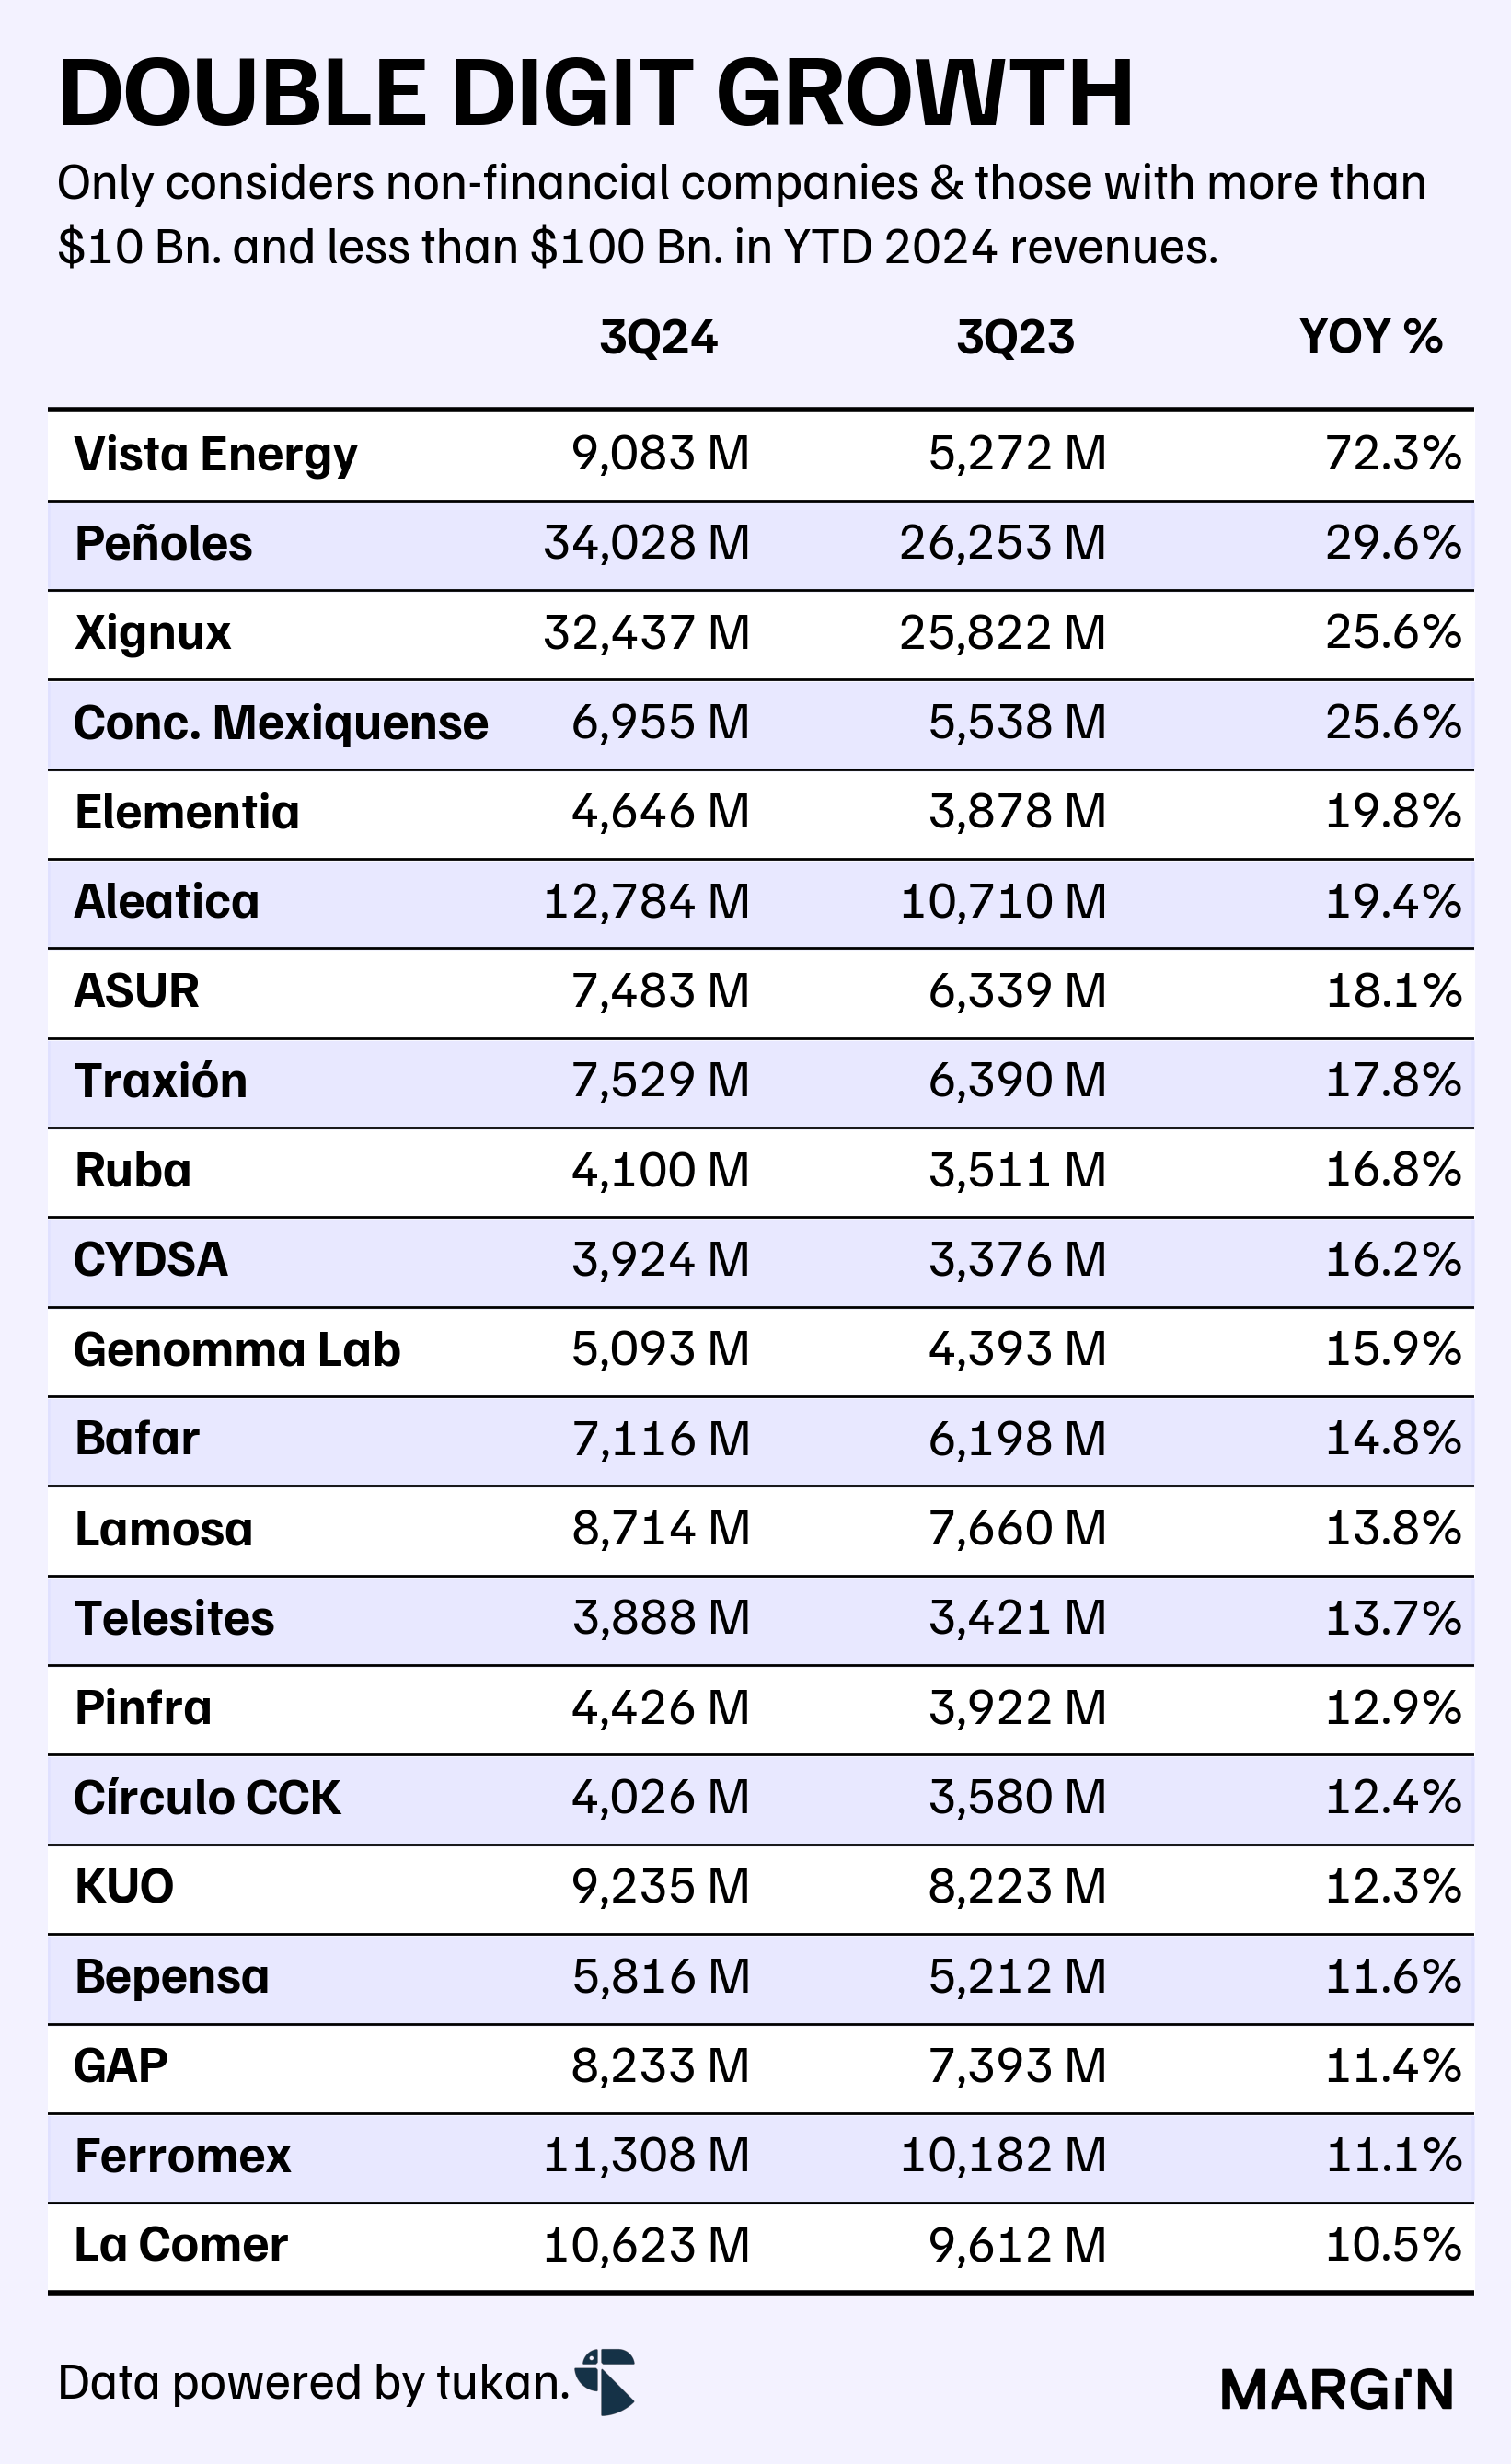
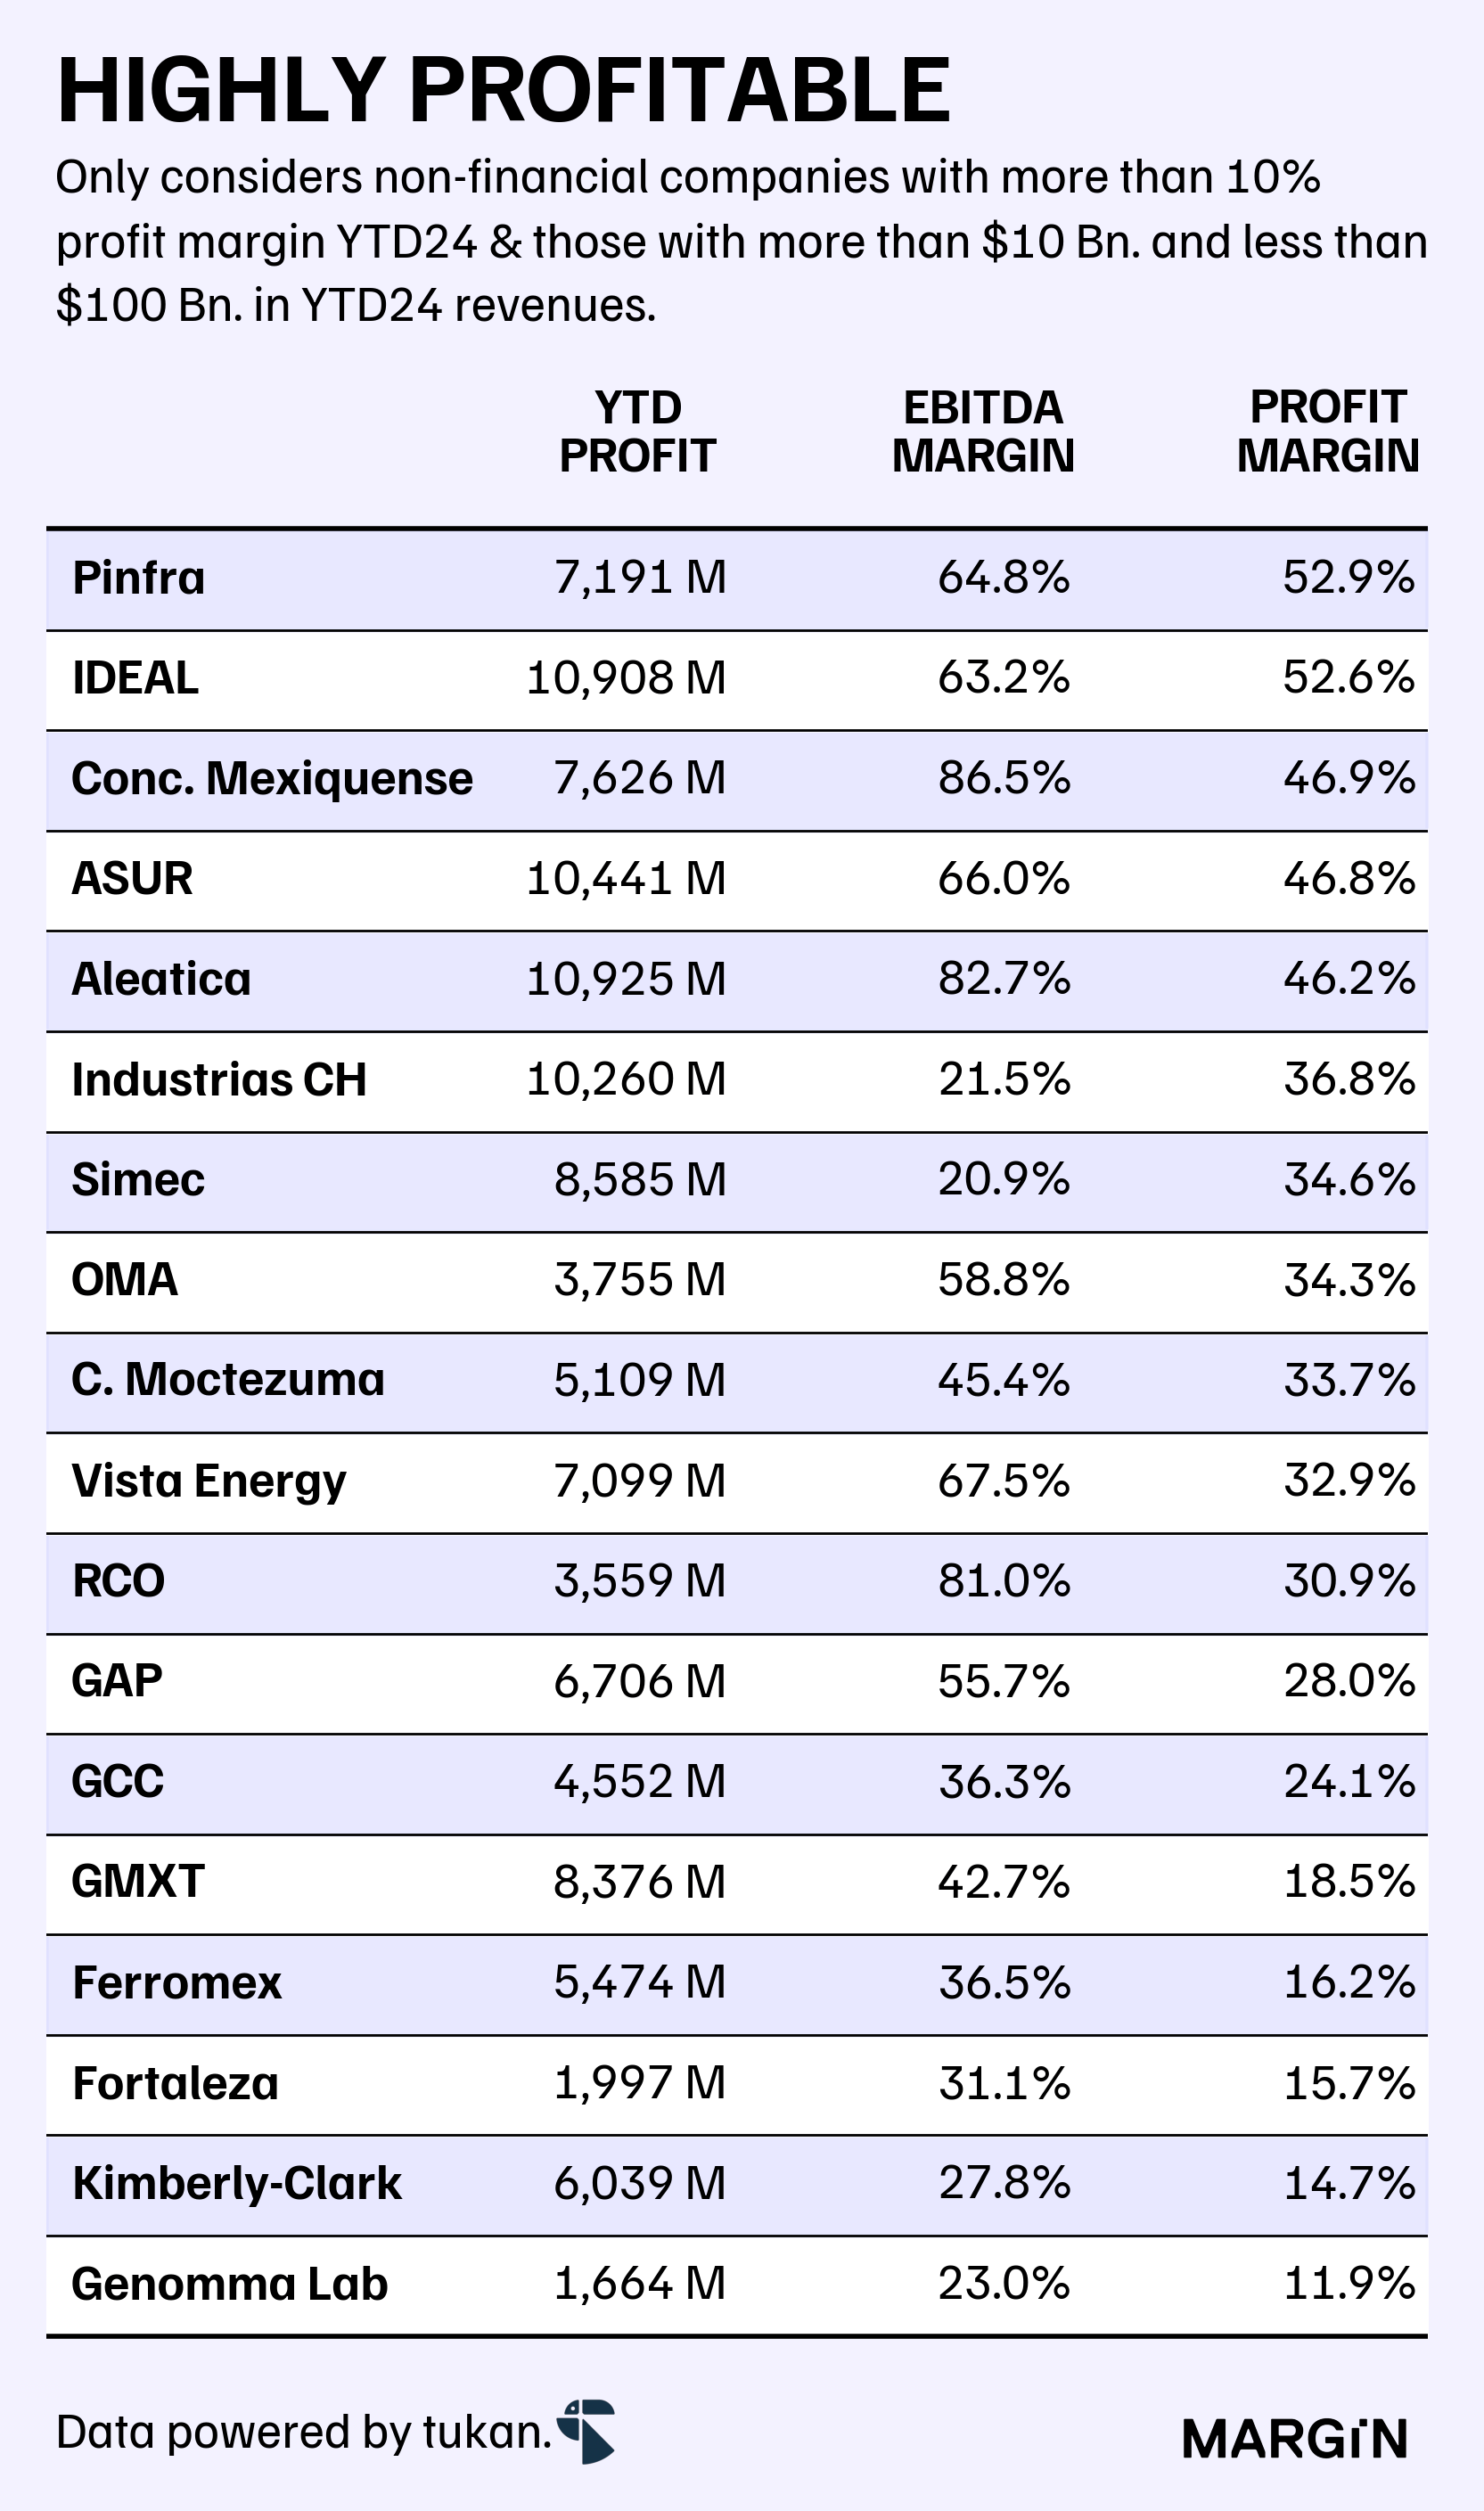
Switching over to businesses with year-to-date revenues between $10 billion and $100 billion pesos, we found that only 8 out of 51 companies posted contractions in their third-quarter income figures.
At the other end of the spectrum, 21 companies reported double-digit increases in their top-line. Vista Energy leads the group with 72% YoY growth, followed by Peñoles with 30% and Xignux with 26%.
In terms of profitability, six companies recorded negative figures on their bottom line during the first nine months of the year, with the median profit margin for the group standing at 5.5%—a ratio 100 basis points (bps) lower than in 2023.
Interestingly, within the group of companies boasting profit margins above 25%, we predominantly find concession-related businesses, such as the three major airport groups, PINFRA, Aleatica, and Red de Carreteras de Occidente (RCO).
Overall, the third quarter appeared to be a strong period in terms of financial results for Mexican companies, as the market demonstrated robust revenue growth and EBITDA margin expansions compared to last year—albeit from a lower comparable basis.
If you’re interested on exploring all figures with a bit more detail, we’ve provided an Excel file with the key figures exclusively for Margin subscribers. We hope you find it useful.
Considering revenue per company to make periods comparable across time.